Mortality From or With Pneumoconiosis
There are two Occupational Health Indicators for pneumoconiosis: hospitalizations for pneumoconiosis and deaths for which pneumoconiosis is the primary or contributing cause. Here we present deaths in which pneumoconiosis is a primary or contributing cause. These data are based on Minnesota death certificates.
Pneumoconiosis refers to a group of interstitial lung diseases that result from inhalation of dusts, particularly mineral or metal dusts. The distinction between each type of pneumoconiosis is dependent upon the type of dust the individual was exposed to. While there are many types of dusts and corresponding lung diseases, the primary pneumoconioses are asbestosis, silicosis, and coal workers’ pneumoconiosis, caused respectively by asbestos fibers, silica, and coal dust. The dust exposure may lead to inflammation and irreversible damage of the lung tissue, eventually decreasing lung function and frequently leading to disability and possibly death. While the overwhelming majority of pneumoconiosis cases are due to occupational exposures, rare cases have been attributed to environmental exposures such as through contaminated work clothes brought into the home.
Pneumoconioses put people at increased risk of other lung diseases, such chronic bronchitis, emphysema, lung cancer, pleuritis, and tuberculosis. Many occupations and industries have been associated with an increased risk of death from pneumoconiosis. Some common industries include mining (coal, metal, mineral), ship building and repair, iron and steel foundries, and construction. Some common occupations include laborers, insulation workers, boiler makers, locomotive workers, mining occupations, plumbers, pipefitters, electricians, carpenters, and millwrights.
Pneumoconioses tend to occur many years – often many decades – after the onset of exposure, typically well after the individual has changed jobs or has retired. As with other occupational illnesses that have long latency periods, only a small portion of pneumoconioses are identified and reported by employer-based reporting systems or workers’ compensation claims. Consequently, hospitalization data and death certificate data are frequently used data sources for monitoring rates and trends of these diseases. The use of death certificate date to identify cases of pneumoconiosis can lead to a possible undercount if the cause of death is inappropriately identified or miscoded. As the indicator makes use of both the primary and contributing cause of death, the likelihood of missing a case is reduced. Even with the possible undercount in the number of cases, the indicator provides a useful measure of the rates and trends of pneumoconiosis-related deaths in Minnesota.
Data from the NIOSH National Occupational Respiratory Mortality System indicates that 33,973 individuals had pneumoconiosis listed as either a primary or contributing cause of death in the United States between 2000 and 2014. During that same time period, a total of 419 pneumoconiosis deaths occurred in Minnesota. In both Minnesota and the U.S., 96.5% of the deaths were among males.
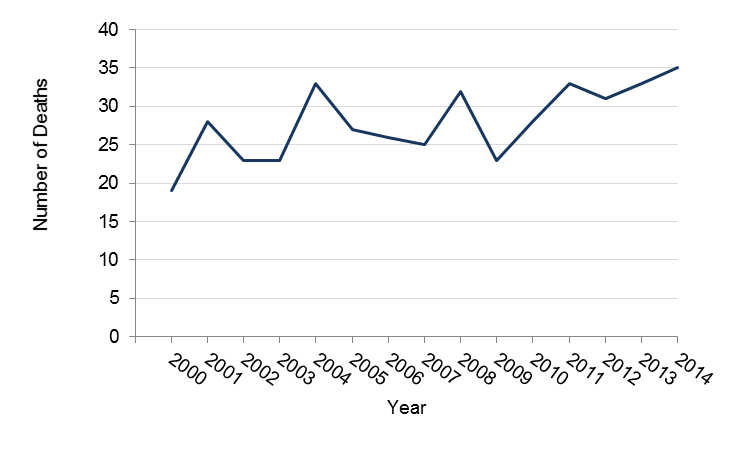
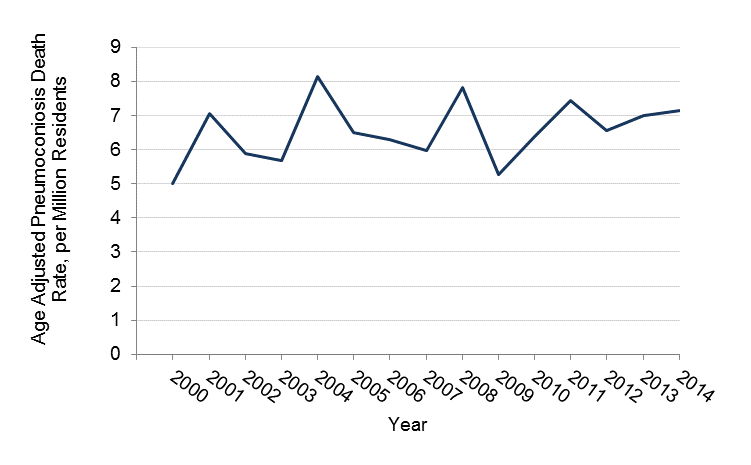
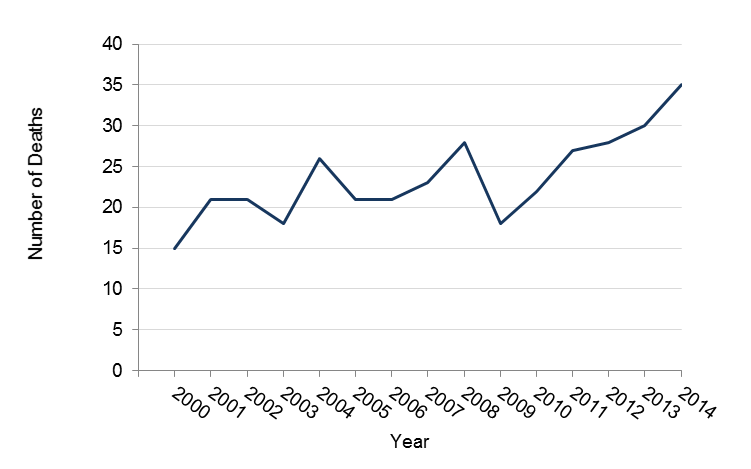
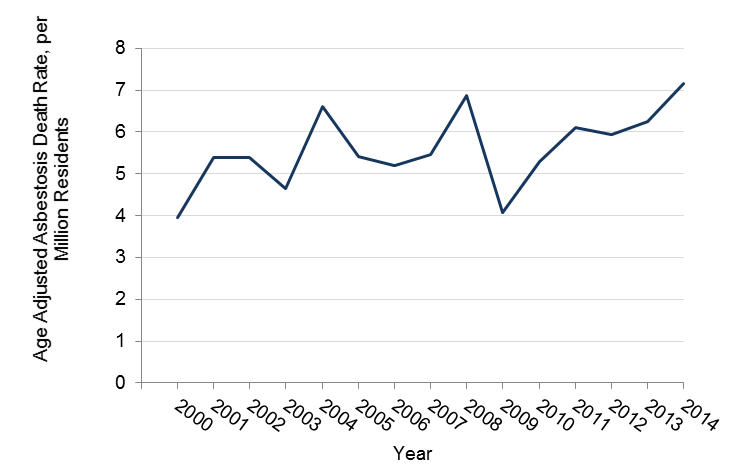
The tables and figures below show the annual numbers and rates of death in Minnesota and in the US in which pneumoconiosis was the underlying or contributing cause of death. Rates are also shown separately for asbestosis and silicosis deaths. All rates are annual age-adjusted rates per million persons age 15 years and above.
Numbers and Age-Adjusted Rates of Total Pneumoconiosis Deaths in Minnesota, 2000-2014
| Year | Number | Rate* per Million Residents |
| 2000 | 19 | 5.0 |
| 2001 | 28 | 7.1 |
| 2002 | 23 | 5.9 |
| 2003 | 23 | 5.7 |
| 2004 | 33 | 8.2 |
| 2005 | 27 | 6.5 |
| 2006 | 26 | 6.3 |
| 2007 | 25 | 5.9 |
| 2008 | 32 | 7.8 |
| 2009 | 23 | 5.3 |
| 2010 | 28 | 6.4 |
| 2011 | 33 | 7.4 |
| 2012 | 31 | 7.2 |
| 2013 | 33 | 7.6 |
| 2014 | 35 | 8.0 |
| 2000-2014 | 419 | - |
*the age-adjusted rate is calculated with eight, ten-year age categories.
Numbers and Age-Adjusted Rates of Total Pneumoconiosis Deaths in the U.S., 2000-2014
| Year | Number | Rate per Million Residents |
| 2000 | 2,864 | 13.2 |
| 2001 | 2,747 | 12.4 |
| 2002 | 2,720 | 12.1 |
| 2003 | 2,639 | 11.5 |
| 2004 | 2,531 | 10.9 |
| 2005 | 2,430 | 10.3 |
| 2006 | 2,312 | 9.6 |
| 2007 | 2,194 | 8.9 |
| 2008 | 2,160 | 8.6 |
| 2009 | 1,998 | 7.9 |
| 2010 | 2,037 | 7.9 |
| 2011 | 1,898 | 7.3 |
| 2012 | 1,860 | 6.9 |
| 2013 | 1,868 | 6.8 |
| 2014 | 1,793 | 6.4 |
| 2000-2014 | 34,051 | -- |
Numbers of All Pneumoconiosis Deaths in Minnesota, 2000-2014
Age-Adjusted Pneumoconiosis Death Rates in Minnesota, 2000-2014
Numbers and Age-Adjusted Rates of Asbestosis Deaths in Minnesota, 2000-2014
| Year | Number | Rate* per Million Residents |
| 2000 | 15 | 4.0 |
| 2001 | 21 | 5.4 |
| 2002 | 21 | 5.4 |
| 2003 | 18 | 4.5 |
| 2004 | 26 | 6.6 |
| 2005 | 21 | 5.4 |
| 2006 | 21 | 5.2 |
| 2007 | 23 | 5.5 |
| 2008 | 28 | 6.9 |
| 2009 | 18 | 4.1 |
| 2010 | 22 | 5.3 |
| 2011 | 27 | 6.1 |
| 2012 | 28 | 6.5 |
| 2013 | 30 | 6.9 |
| 2014 | 35 | 8.0 |
| 2000-2014 | 354 | - |
*The age adjusted rate is calculated using eight ten-year age categories.
Numbers and Age-Adjusted Rates of Asbestosis Deaths in the U.S.*
| Year | Number | Rate per Million Residents |
| 2000 | 1,493 | 6.9 |
| 2001 | 1,454 | 6.6 |
| 2002 | 1,473 | 6.6 |
| 2003 | 1,471 | 6.5 |
| 2004 | 1,470 | 6.3 |
| 2005 | 1,423 | 6.0 |
| 2006 | 1,344 | 5.6 |
| 2007 | 1,401 | 5.7 |
| 2008 | 1,346 | 5.4 |
| 2009 | 1,262 | 5.0 |
| 2010 | 1,318 | 5.1 |
| 2011 | 1,252 | 4.9 |
| 2012 | 1,219 | 4.6 |
| 2013 | 1,238 | 4.5 |
| 2014 | 1,221 | 4.4 |
| 2000–2014 | 20,385 | - |
*Source: http://webappa.cdc.gov/ords/norms.html
Number of Asbestosis Deaths in Minnesota, 2000-2014
Age-Adjusted Asbestosis Death Rates in Minnesota, 2000-2014
Numbers and Age-Adjusted Rates of Silicosis Deaths in Minnesota, 2000-2014
| Year | Number | Rate* per Million Residents |
| 2000 | 3 | 0.8 |
| 2001 | 6 | 1.5 |
| 2002 | 1 | 0.2 |
| 2003 | 3 | 0.7 |
| 2004 | 5 | 1.3 |
| 2005 | 5 | 1.1 |
| 2006 | 4 | 0.9 |
| 2007 | 2 | 0.5 |
| 2008 | 3 | 0.7 |
| 2009 | 3 | 0.7 |
| 2010 | 4 | 0.9 |
| 2011 | 5 | 1.1 |
| 2012 | 0 | 0 |
| 2013 | 3 | 0.7 |
| 2014 | 0 | 0 |
| 2000-2014 | 47 | - |
*The age-adjusted rate per million residents is also shown and is calculated using eight ten-year age categories. Some precaution must be made when interpreting rates from small numbers, as some years had fewer than 5 deaths attributed to silicosis these rates may not be reliable.
Numbers and Age-Adjusted Rates of Silicosis Deaths in the U.S., 2000-2014
| Year | Number | Rate* per Million Residents |
| 2000 | 152 | 0.7 |
| 2001 | 164 | 0.7 |
| 2002 | 148 | 0.7 |
| 2003 | 179 | 0.8 |
| 2004 | 166 | 0.7 |
| 2005 | 161 | 0.7 |
| 2006 | 126 | 0.5 |
| 2007 | 123 | 0.5 |
| 2008 | 148 | 0.6 |
| 2009 | 121 | 0.5 |
| 2010 | 101 | 0.4 |
| 2011 | 89 | 0.3 |
| 2012 | 103 | 0.4 |
| 2013 | 111 | 0.4 |
| 2014 | 84 | 0.3 |
| 2000-2014 | 1,976 | - |
*The age-adjusted rate per million residents using eight ten-year age categories.
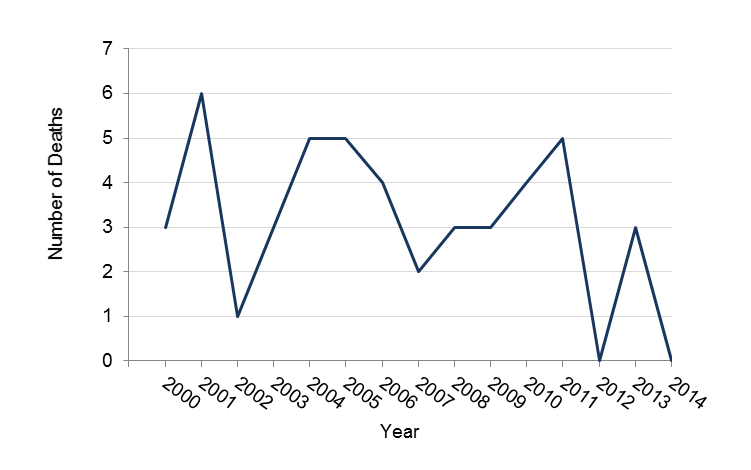
Number of Silicosis Deaths in Minnesota, 2000-2014
Age-Adjusted Silicosis Death Rates* in Minnesota, 2000-2014
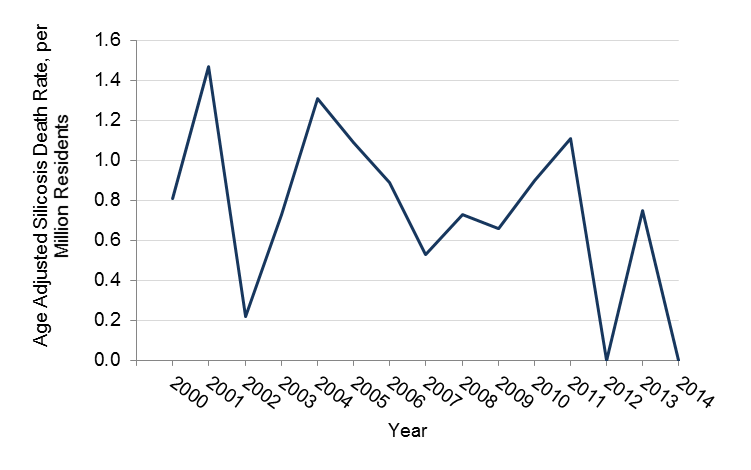
*The rate is calculated using eight, ten year categories. Some precaution must be made when interpreting rates from small numbers, as some years had fewer than 5 deaths attributed to silicosis these rates may not be stable.
A trend analysis suggested that total deaths attributed to any form of pneumoconiosis and to silicosis had a non-significant increase from 2000 to 2014 in Minnesota. The number of deaths attributed to asbestosis was found to have a statistically non-significant increase between 2000 and 2014 in Minnesota. The short time period used in this analysis and the small numbers of cases (particularly for silicosis) limit the conclusions that can be drawn about whether pneumoconioses deaths are increasing or decreasing. Longer-term data for the U.S. from the NIOSH Work-Related Lung Disease Surveillance System provide a more complete picture of trends. These data showed declining mortality rates for coal workers’ pneumoconiosis since 1982, declining silicosis mortality since 1968, but increasing asbestosis mortality from 1968 until around 2000, before starting to decline. The long latency of the pneumoconioses means that the deaths occurring in a particular year are due to exposures that occurred decades earlier. Continued surveillance is necessary to monitor the effectiveness of regulatory standards and whether workers remain at risk.