Cardiovascular Health
- Cardiovascular Health Home
- CVH Data and Trends
- CVH Programs & Resources
- Minnesota 2035 Plan
- Minnesota Stroke Program
- About Us
Learn More
Related Topics
Cardiovascular Health Indicator
Measure: High Blood Pressure Prevalence
| Indicator | Date of Most Recent Measure | Current Measure | Trend |
|---|---|---|---|
| Percentage of adults who have been told they have high blood pressure | 2021 | 26.6% | Getting Worse |
Overview
- In 2021, 26.6% of Minnesota adults reported that they have been told they have high blood pressure by their doctor or another health professional, impacting approximately 1.3 million people.
- From 2011 through 2017, Minnesota’s high blood pressure prevalence was lower than every other state. Since 2019 it has been tied for the 2nd lowest.
- More than half of Minnesota adults aged 65 or older reported being told they have high blood pressure.
- In 2021, 78.4% of Minnesota adults with high blood pressure reported taking a blood pressure medication.
- Minnesota adults who have a disability were more likely to report having high blood pressure than adults who are not disabled—especially those with disabilities impacting vision, mobility, self care, and independent living.
- More than one third of adults who experienced 14 or more poor mental health days reported having high blood pressure.
See Also:
Quick Facts about High Blood Pressure
Analysis
From 2011 through 2017, Minnesota adults reported the lowest age-adjusted high blood pressure prevalence of any state in the country. Since 2019, Minnesota's rank has been tied for 2nd lowest among all states. Table 1 shows the trend from 2011 through 2021, with a small statistically significant increase in the percentage of adults reporting they have been told they have high blood pressure since 2017. An additional analysis of Minnesota adults with insurance coverage in 2014 showed similar rates of age-adjusted hypertension prevalence (25.4%). See the "Other Resources" tab for more detail on this analysis.
Medication can be prescribed to help lower blood pressure for people with high blood pressure, also known as hypertension. In Minnesota in 2021, 78.4% of people who said they had high blood pressure also reported taking a blood pressure medication.
Table 1: High Blood Pressure Awareness, Minnesota Adults, 2011-2021
| Year | Age-Adjusted Prevalence | 95% Confidence Interval |
|---|---|---|
| 2011 | 25.0% | (24.2-25.9%) |
| 2013 | 25.2% | (24.0-26.4%) |
| 2015 | 24.2% | (23.4-24.9%) |
| 2017 | 24.3% | (23.6-25.0%) |
| 2019 | 26.1% | (25.3-26.8%) |
| 2021 | 26.6% | (25.9-27.4%) |
The percentage of adults who report being told that they have high blood pressure increases with age. Chart 1 and Table 2 show the overall prevalence of hypertension for Minnesota adults by age group in 2019. More than half of adults aged 65 or older report being told they have high blood pressure, compared to just one in twenty adults aged 18-24.
Chart 1: High Blood Pressure Awareness by Age Group, Minnesota Adults, 2021
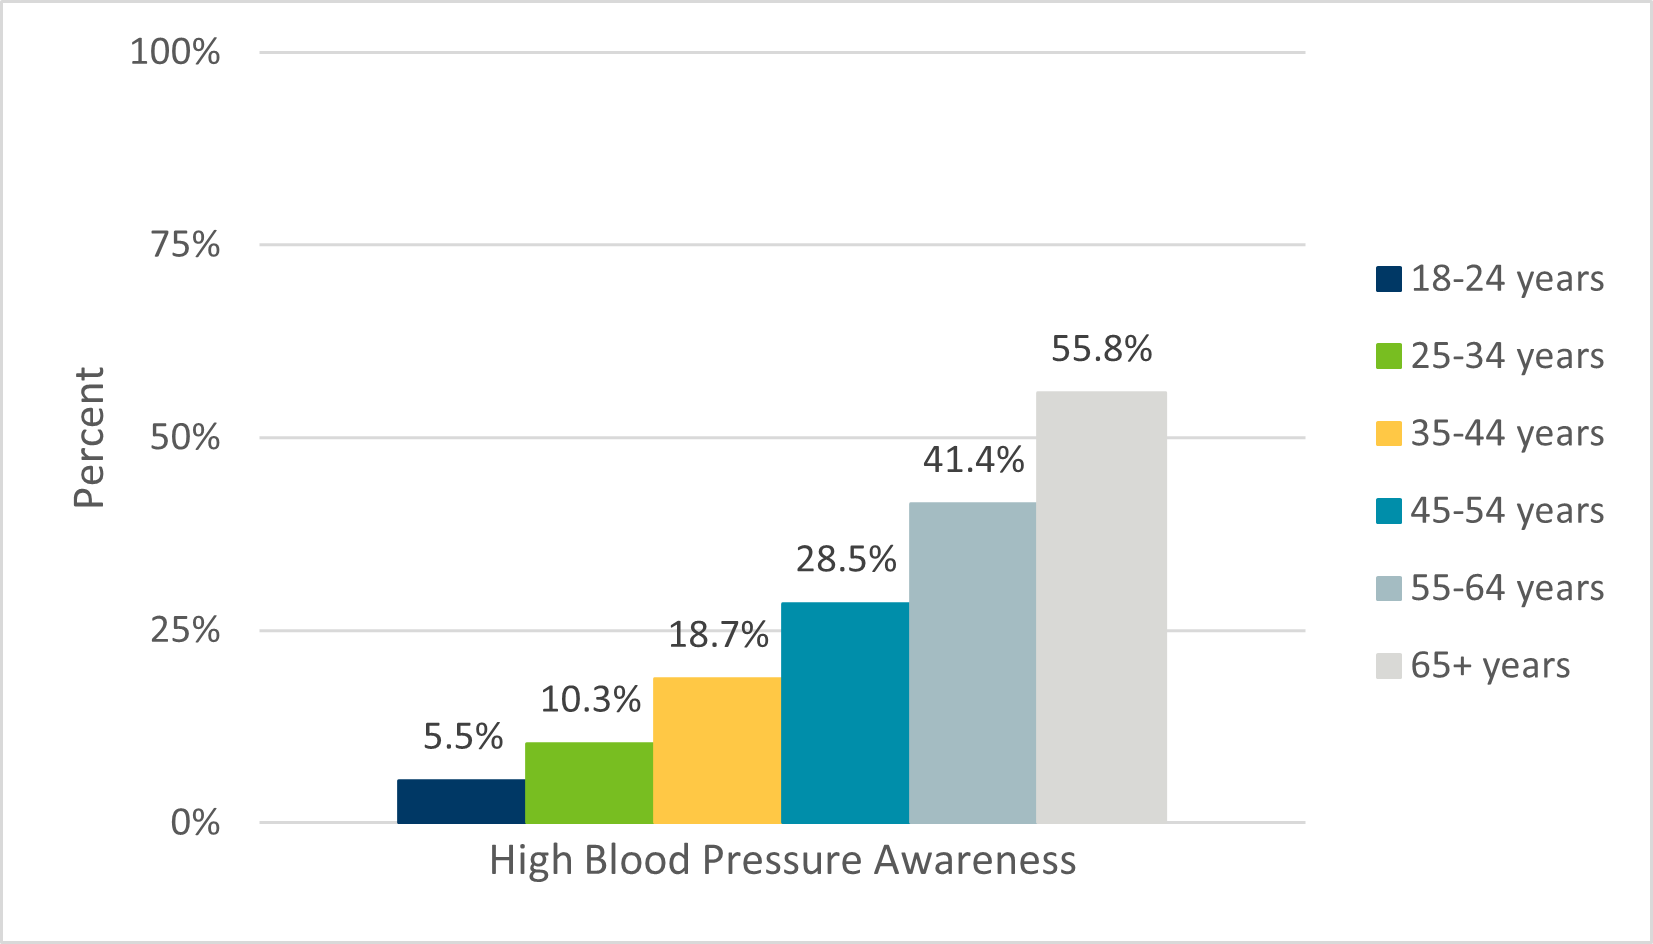
Table 2: High Blood Pressure Awareness by Age Group, Minnesota Adults, 2021
| Age Group | Prevalence | 95% Confidence Interval |
|---|---|---|
| 18-24 years | 5.5% | (3.9-7.1%) |
| 25-34 years | 10.3% | (8.7-12.0%) |
| 35-44 years | 18.7% | (16.9-20.6%) |
| 45-54 years | 28.5% | (26.5-30.5%) |
| 55-64 years | 41.4% | (39.2-43.5%) |
| 65+ years | 55.8% | (54.0-57.5%) |
In addition to differences by age group, there are differences in high blood pressure prevalence by sex, with more Minnesota men than women reporting being told they have high blood pressure in 2021, as shown in Table 3 below.
Table 3: High Blood Pressure Awareness by Sex, Minnesota Adults, 2021
| Sex | Prevalence | 95% Confidence Interval |
|---|---|---|
| Male | 31.6% | (30.4-32.8%) |
| Female | 27.2% | (26.1-28.4%) |
As shown in Table 4, age-adjusted high blood pressure prevalence is highest for African American/African (32.7%) and American Indian (36.0%) adults in Minnesota. Asian and Hispanic adults have the lowest prevalence of hypertension, at 23.3% and 23.6% respectively.
Table 4: High Blood Pressure Awareness by Race/Ethnicity, Minnesota Adults, 2021
| Race/Ethnicity | Age-Adjusted Prevalence | 95% Confidence Interval |
|---|---|---|
| White | 26.4% | (25.5-27.2%) |
| African American/African | 32.7% | (29.0-36.4%) |
| American Indian | 36.0% | (27.9-44.0%) |
| Asian | 23.3% | (17.7-28.9%) |
| Hispanic | 23.6% | (19.6-27.5%) |
There are also differences in high blood pressure prevalence between adults with and without a disability. Additionally, disparities in high blood pressure based on the type of disability also exist. Chart 2 and Table 5 show the age-adjusted prevalence of high blood pressure for adults without a disability, as well adults with a disability, categorized by type of disability. Among adults without a disability, 24.2% reported having high blood pressure. Minnesota adults with any reported disability were more likely to report high blood pressure. Adults with disabilities affecting vision, mobility, independent living, and self-care were most likely to report having high blood pressure.
Chart 2: High Blood Pressure Awareness by Disability Status and Type of Disability, Minnesota Adults, 2021
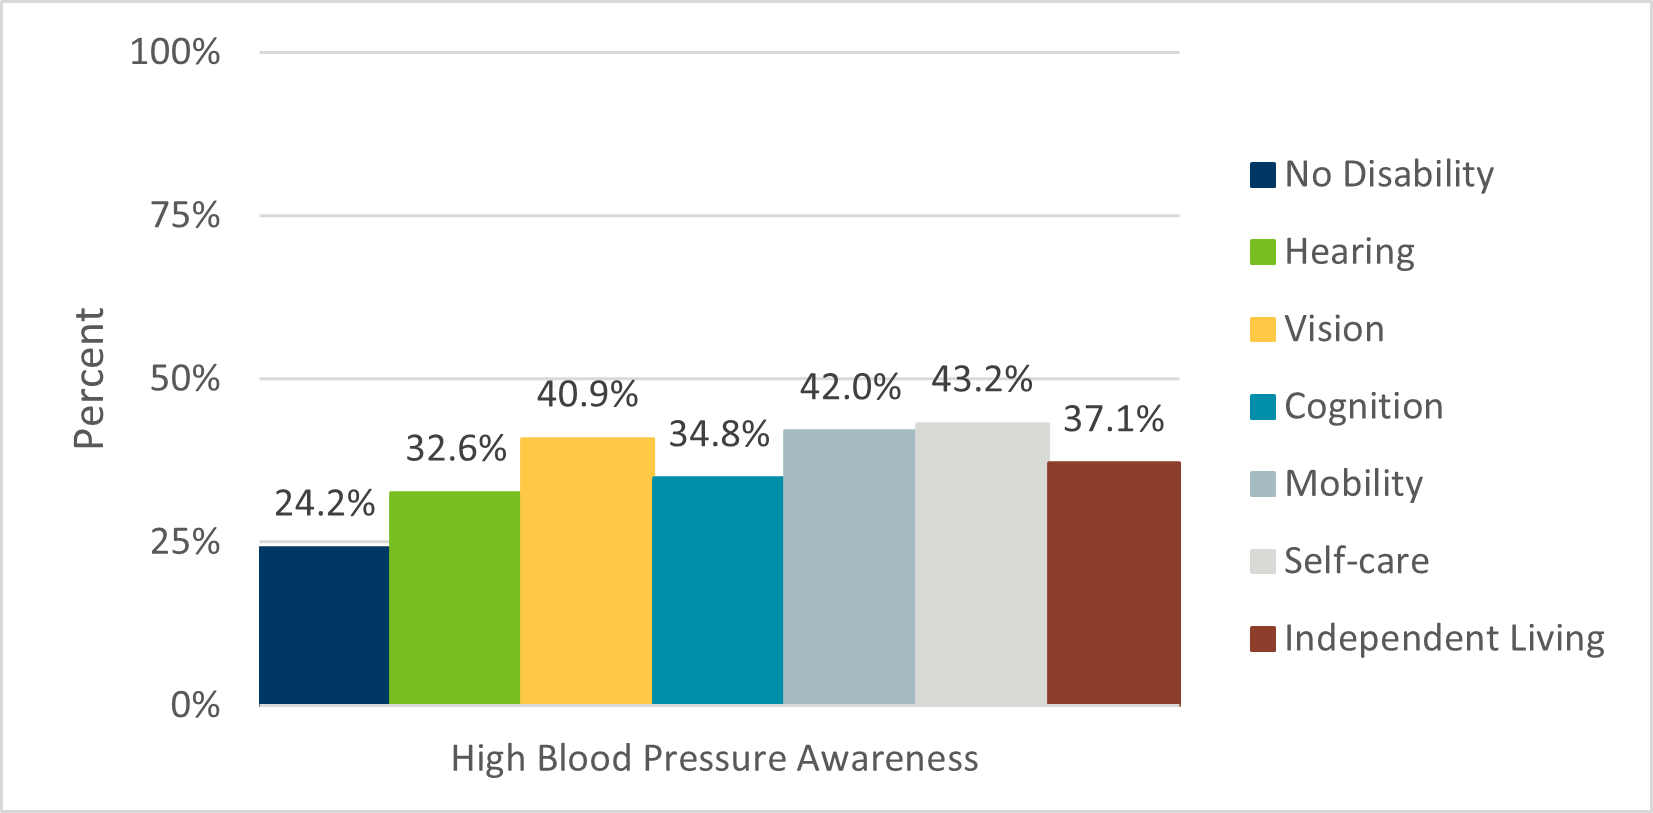
Table 5: High Blood Pressure Awareness by Disability Status and Type of Disability, Minnesota Adults, 2021
| Type of Disability | Age-Adjusted Prevalence | 95% Confidence Interval |
|---|---|---|
| Not Disabled | 24.2% | (23.4-25.1%) |
| Hearing | 32.6% | (28.0-37.2%) |
| Vision | 40.9% | (35.1-46.8%) |
| Cognition | 34.8% | (32.2-37.4%) |
| Mobility | 42.0% | (37.6-46..4%) |
| Self-care | 43.2% | (35.8-50.5%) |
| Independent Living | 37.1% | (33.4-40.8%) |
*Note–people may have more than one disability
Mental health conditions such as depression and anxiety are known to influence health behaviors, which can impact the risk of high blood pressure. Table 6 shows the prevalence of high blood pressure among Minnesota adults based on the number of days within the past 30 days a person experiences poor mental health. Prevalence of high blood pressure was similar among adults who did not experience poor mental health and those who experience 1-13 poor mental health days. About a third of adults who have had at least 14 poor mental health days had high blood pressure.
Table 6: High Blood Pressure Awareness by Mental Health Indicator, Minnesota Adults, 2021
| Number of poor mental health days within the past 30 days | Age-Adjusted Prevalence | 95% Confidence Interval |
|---|---|---|
| 0 days | 25.1% | (24.1-26.1%) |
| 1-13 days | 26.5% | (25.0-28.0%) |
| 14+ days | 33.2% | (30.8-35.6%) |