Cardiovascular Health
- Cardiovascular Health Home
- CVH Data and Trends
- CVH Programs & Resources
- Minnesota 2035 Plan
- Minnesota Stroke Program
- About Us
Learn More
Related Topics
Cardiovascular Health Indicator
Measure: Heart Disease Death Rate
| Indicator | Date of Most Recent Measure | Current Measure | Trend |
|---|---|---|---|
| Age-adjusted mortality rate due to heart disease | 2021 | 123.9 per 100,000 | Stable |
Overview
- Heart disease is the second-leading cause of death in Minnesota, responsible for 16.6% of all deaths in 2021. This is a lower proportion of overall deaths than is typical, as COVID-19 became the third-leading cause of death in 2020.
- Minnesota’s heart disease death rate has been lowest of all states since 1999, and is 29% lower than the United States average in 2021.
- In Minnesota, American Indian people die from heart disease at much higher rates than every other race and ethnic group, at more than 50% higher than Minnesotans overall. These disparities in deaths are rooted in historical inequities that have persisted in the United States and Minnesota for many years.
- Heart disease deaths have been dropping for decades, but this trend has stopped. In 2020 and 2021, there were more than 1,400 additional deaths due to heart disease compared to 2010 (up almost 20%), but the overall heart disease death rate hasn't changed much.
See Also:
Analysis
As shown in Chart 1 and Table 1 below, the heart disease death rate has declined since 2007, but it still remains the second-leading cause of death in Minnesota. More men die of heart disease than women, and at younger ages, which explains the higher age-adjusted death rate for men compared to women. Total deaths were lowest in 2010 and have risen by 20% in the years since, with 1,400 more deaths in 2020 compared to ten years earlier. Most of that increase has been in men. Even though the number of deaths has started to increase, death rates have remained relatively stable. This can be explained by our aging population, with the number of older people who are at a risk of dying from heart disease also increasing each year.
Chart 1: Death Rate due to Heart Disease for all Minnesotans and by sex, 2007-2021
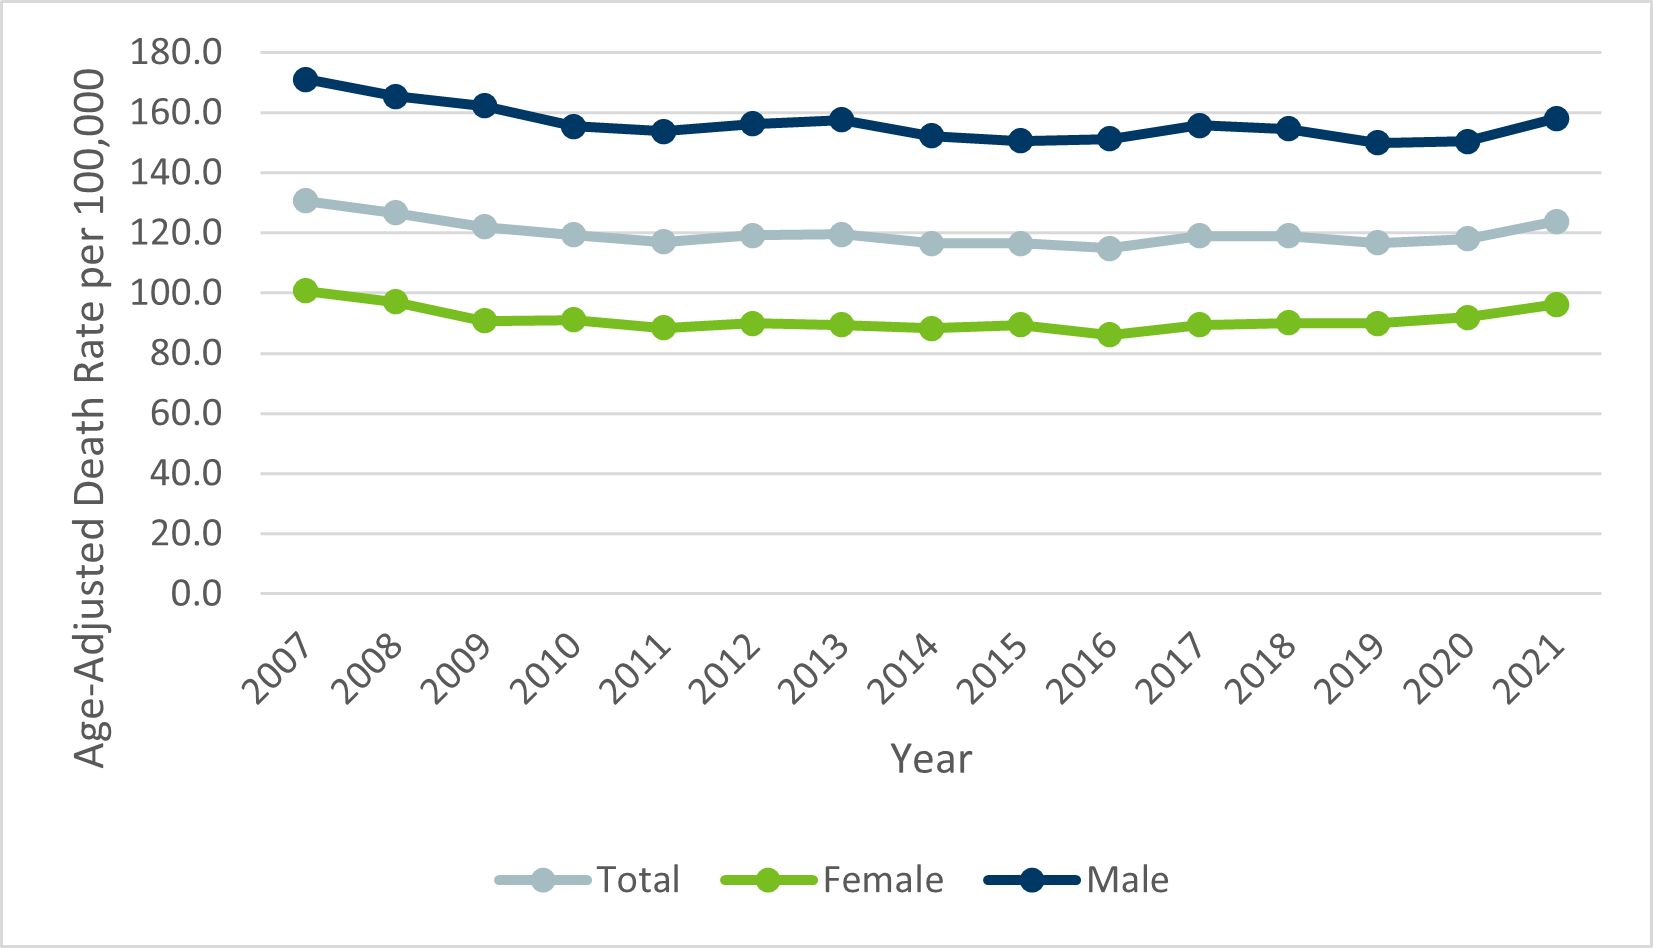
Table 1: Total Deaths and Death Rate due to Heart Disease for all Minnesotans and by sex, 2007-2021
| Year | Total Number of Deaths | Total Age-Adjusted Death Rate (per 100,000) | Number of Deaths, Females | Age-Adjusted Death Rate (per 100,000 Females) | Number of Deaths, Males | Age-Adjusted Death Rate (per 100,000 Males) |
|---|---|---|---|---|---|---|
| 2007 | 7,477 | 130.7 | 3,652 | 100.8 | 3,825 | 171.1 |
| 2008 | 7,367 | 126.6 | 3,545 | 97.1 | 3,822 | 165.4 |
| 2009 | 7,238 | 122.1 | 3,407 | 90.8 | 3,831 | 162.2 |
| 2010 | 7,185 | 119.4 | 3,451 | 91.1 | 3,734 | 155.4 |
| 2011 | 7,240 | 117.0 | 3,400 | 88.5 | 3,840 | 153.8 |
| 2012 | 7,496 | 119.2 | 3,502 | 90.0 | 3,994 | 156.3 |
| 2013 | 7,714 | 119.6 | 3,571 | 89.5 | 4,143 | 157.6 |
| 2014 | 7,659 | 116.5 | 3,548 | 88.3 | 4,111 | 152.3 |
| 2015 | 7,844 | 116.6 | 3,685 | 89.5 | 4,159 | 150.6 |
| 2016 | 7,825 | 114.9 | 3,557 | 86.2 | 4,268 | 151.2 |
| 2017 | 8,230 | 119.1 | 3,749 | 89.5 | 4,481 | 155.8 |
| 2018 | 8,408 | 119.0 | 3,835 | 90.1 | 4,573 | 154.6 |
| 2019 | 8,401 | 116.7 | 3,870 | 89.9 | 4,531 | 149.9 |
| 2020 | 8,562 | 118.1 | 3,944 | 91.9 | 4,618 | 150.5 |
| 2021 | 8,568 | 123.9 | 3,890 | 96.3 | 4,678 | 158.1 |
Even though Minnesota has a very low rate of heart disease deaths compared to the United States, there are large disparities in the state. As shown in Chart 2 and Table 2, the death rate due to heart disease is highest in American Indian communities in Minnesota and lowest in Asian/Pacific Islander and Latinx/Hispanic communities. The last column of Table 2 shows a rate ratio, which compares two rates to describe how much one group is impacted compared to another. Any number larger than 1 means that the group of interest is higher than the comparison group. Any number smaller than 1 means that the group of interest is lower than the comparison group. In Table 2, Minnesotans are classified by race and ethnicity and compared to the overall Minnesota population. American Indian people die from heart disease at a rate 1.57 times higher than Minnesotans overall. While the age-adjusted death rate shows little difference in heart disease deaths between African-American/African-Born Minnesotans and the overall Minnesota population, a different picture emerges when looking at death by age groups starting at 35 years. These disparities in deaths are rooted in historical inequities that have persisted in the United States and Minnesota for many years.
Chart 2: Death Rate due to Heart Disease by Race and Ethnicity, 2018-2021
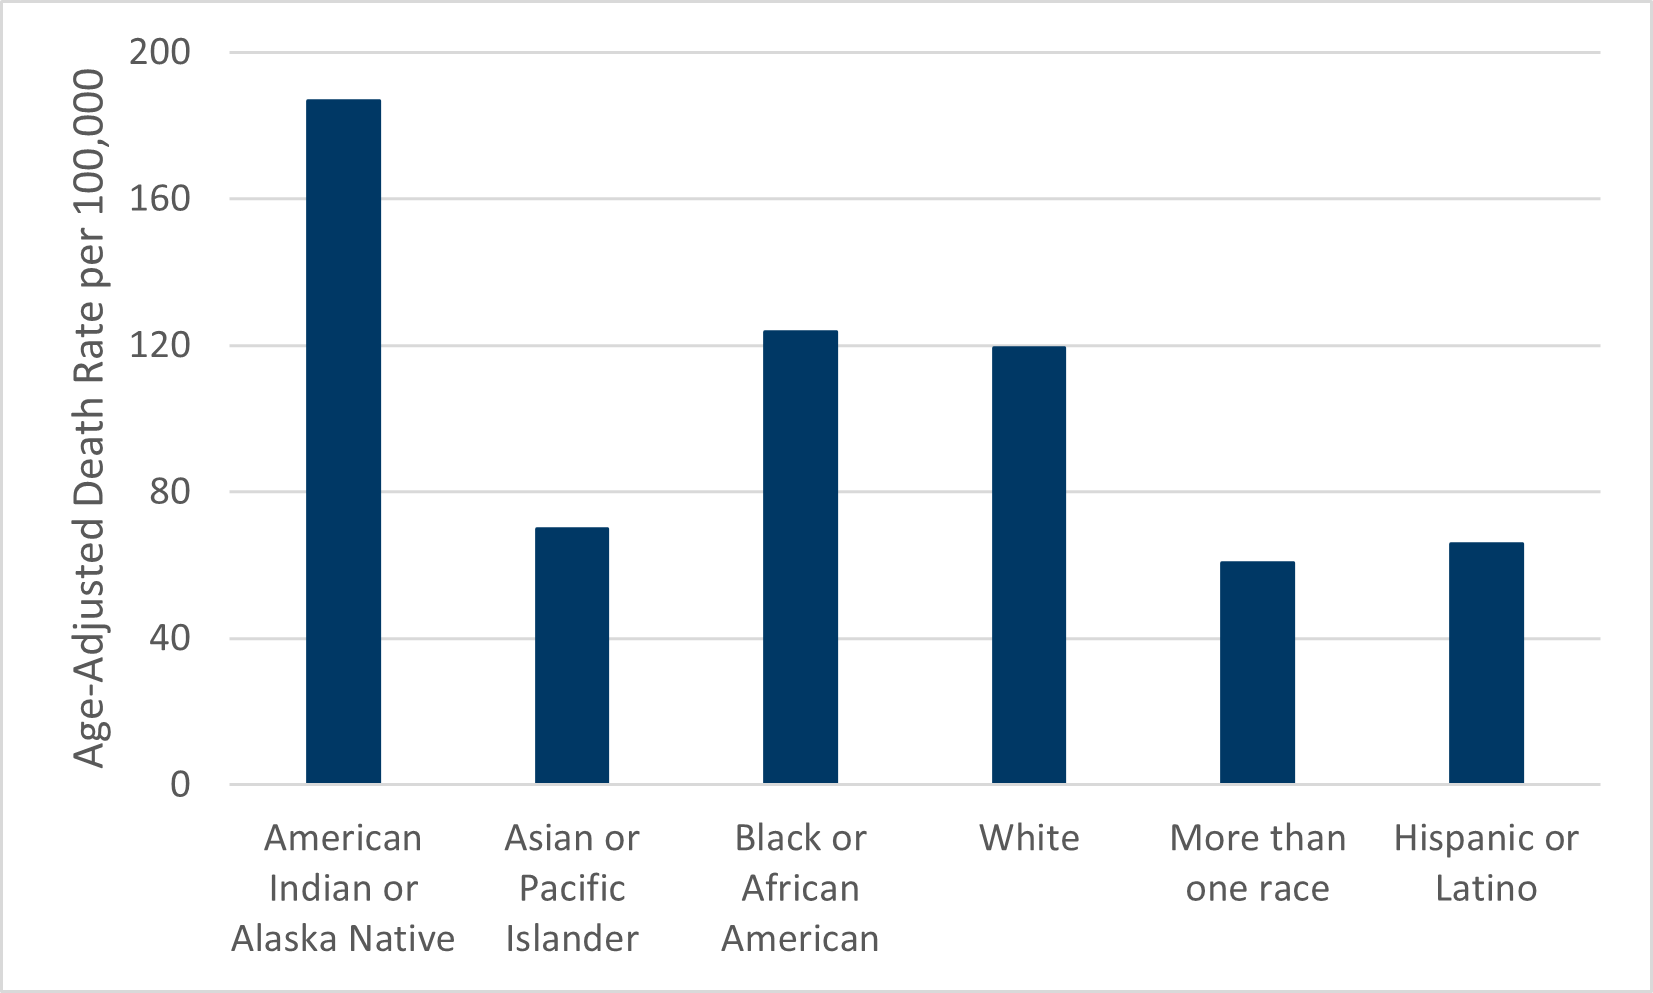
Table 2: Total Deaths and Death Rate due to Heart Disease by Race and Ethnicity, 2018-2021
| Race/Ethnicity | Total Deaths, 2018-2021 | Annual Age-Adjusted Death Rate (per 100,000), 2018-2021 | Rate Ratio, compared to Minnesota rate |
|---|---|---|---|
| All Minnesotans | 33,939 | 119.3 | - |
| American Indian or Alaska Native | 338 | 186.9 | 1.57 |
| Asian or Pacific Islander | 458 | 70.1 | 0.59 |
| Black or African American | 1,033 | 123.7 | 1.04 |
| White | 31,687 | 119.5 | 1.00 |
| More than one race | 106 | 60.6 | 0.51 |
| Hispanic or Latino | 283 | 65.9 | 0.55 |
*The method for for categorizing people by race changed in 2021. Comparison to data from prior dashboard releases is not recommended.
Chart 3 and Table 3 highlight major disparities in heart disease deaths for African American/African-Born and American Indian people in Minnesota. Chart 3 below shows the difference in death rates between African American/African-Born and American Indian people compared to the overall Minnesota population from 2018-2021 by using a rate ratio. Bars that rise above the solid black line show groups that die at higher rates than Minnesotans overall, while bars that remain below the solid black line show groups that die at lower rates.
Among those aged 35 through 64, African American/African-Born people die from heart disease at about 2 times the death rate for Minnesotans overall. For American Indian people, this disparity is even greater, with death rates approximately 2 to 4.5 times higher among those aged 35 to 74. Both African American/African-Born and American Indian people over the age of 85 die from heart disease at a lower rate than Minnesotans overall, but this may be because those who have heart disease in these groups are dying at much younger ages. Table 3 shows the age-specific death rates for African American/African Born and American Indian people, and the rate ratio comparing them to the overall Minnesota population. Asian/Pacific Islander and Latinx/Hispanic communities have lower death rates than the overall Minnesota population in every age group and are not shown in Chart 3 or Table 3.
Chart 3: Rate Ratio of Heart Disease Deaths for African American/African Born and American Indian people vs. Minnesota Average, 2018-2021
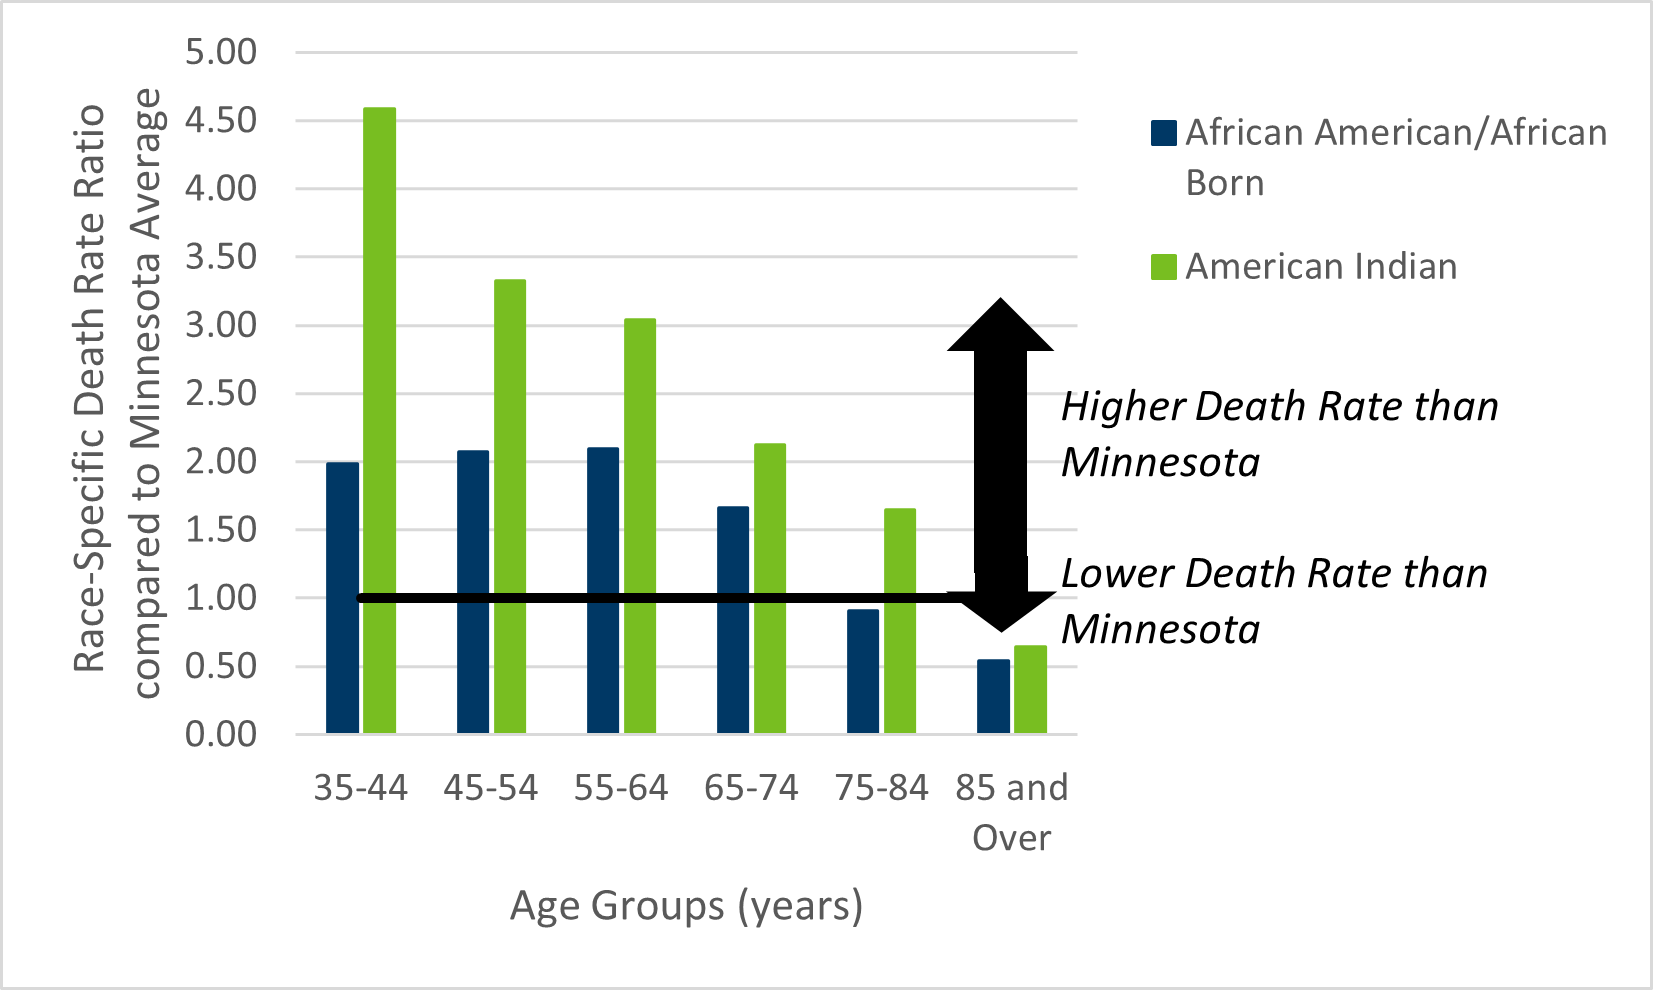
Table 3: Rate Ratio of Heart Disease Deaths by Race and Age Group, 2018-2021
| Age Group (years) | Crude Death Rate (per 100,000), Minnesota | Crude Death Rate (per 100,000), African American/ African-Born | Rate Ratio of African American/African-Born to Minnesota Average | Crude Death Rate (per 100,000), American Indians | Rate Ratio of American Indians to Minnesota Average |
|---|---|---|---|---|---|
| 35-44 | 17.1 | 34.0 | 1.99 | 78.5 | 4.59 |
| 45-54 | 48.9 | 101.5 | 2.08 | 162.7 | 3.33 |
| 55-64 | 103.1 | 216.0 | 2.10 | 313.4 | 3.04 |
| 65-74 | 230.8 | 384.5 | 1.67 | 490.6 | 2.13 |
| 75-84 | 725.7 | 660.8 | 0.91 | 1,194.6 | 1.65 |
| 85 and Over | 3,354.9 | 1,813.4 | 0.54 | 2,153.8 | 0.64 |
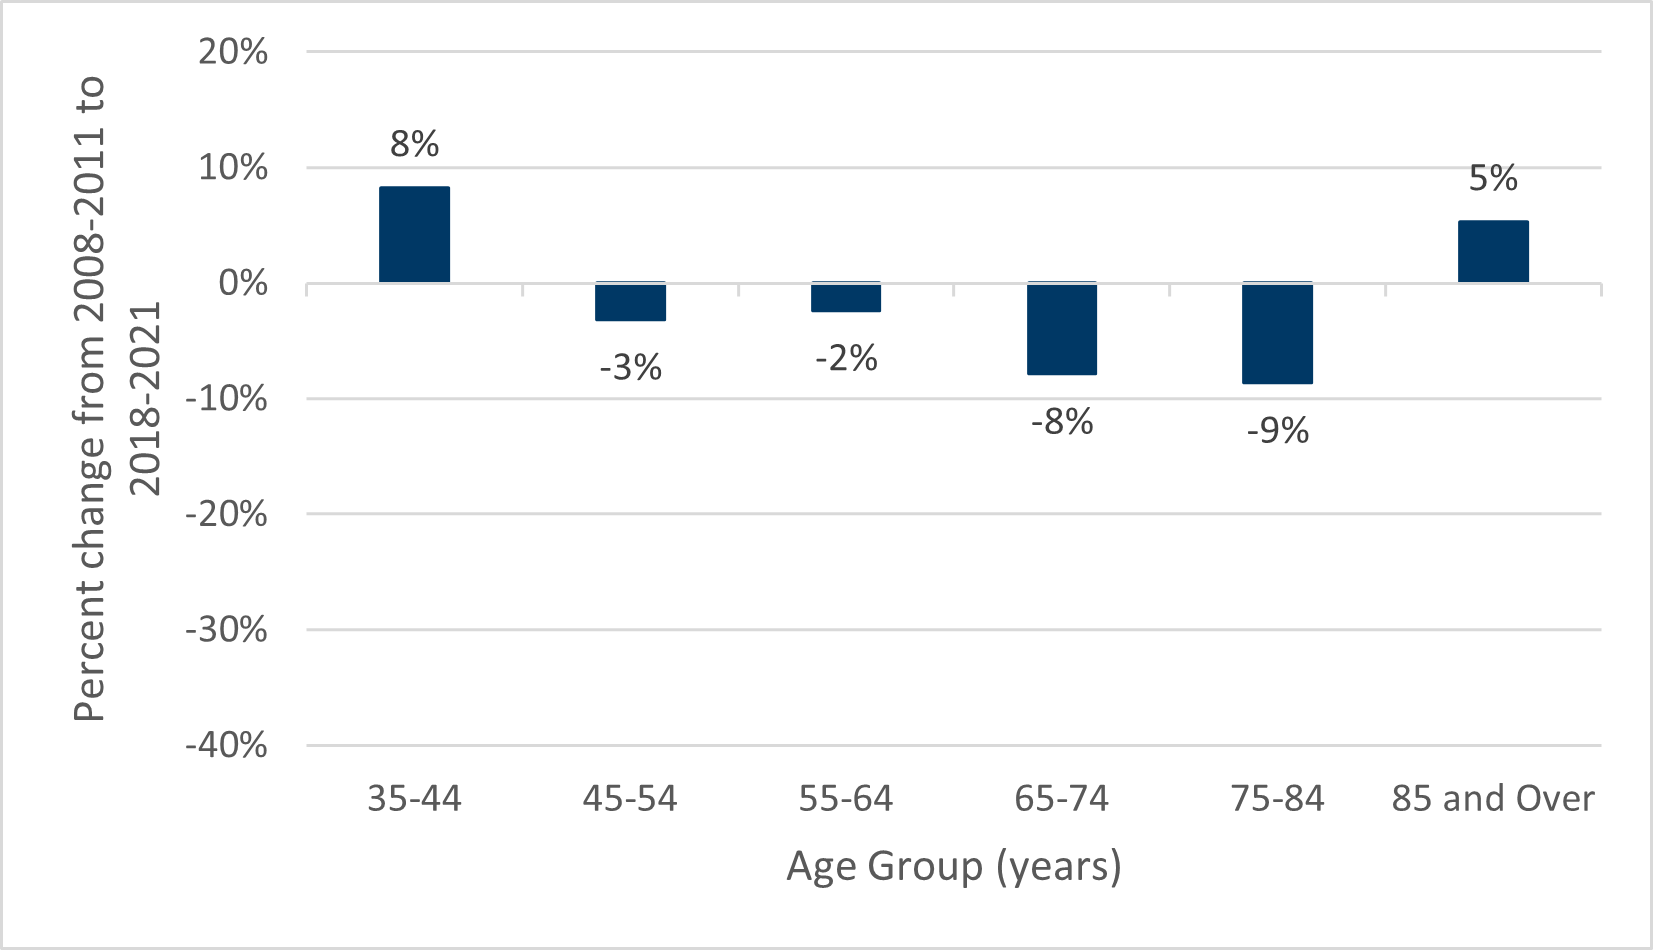
The number of deaths due to heart disease increases in older age groups. Table 4 shows the number of deaths and death rate due to heart disease over the three most recent five-year time periods. Over that 10 year period, the largest declines in death rates have been for Minnesotans ages 65 to 84, as shown in Chart 4. For Minnesotans ages 45 to 64, the declines have been very small. For Minnesotans under age 45, and 85 or older, there has a small increase in the heart disease death rate.
Table 4: Total Deaths and Death Rate due to Heart Disease by Age Group, 2008-2021
| Age Group (years) | Number of Deaths, 2008-2011 | Crude Death Rate (per 100,000), 2008-2011 | Number of Deaths, 2018-2021 | Crude Death Rate (per 100,000), 2018-2021 | Change over 10 years |
|---|---|---|---|---|---|
| 35-44 | 436 | 15.8 | 502 | 17.1 | 8% |
| 45-54 | 1,626 | 50.5 | 1,316 | 48.9 | -3% |
| 55-64 | 2,620 | 105.6 | 3,112 | 103.1 | -2% |
| 65-74 | 3,511 | 250.5 | 5,010 | 230.8 | -8% |
| 75-84 | 7,066 | 794.3 | 7,744 | 725.7 | -9% |
| 85 and Over | 13,551 | 3,186.5 | 16,001 | 3,354.9 | 5% |
Chart 4: Percent change in Death Rate due to Heart Disease by Age Group, from 2008-2011 to 2018-2021