Cardiovascular Health
- Cardiovascular Health Home
- CVH Data and Trends
- CVH Programs & Resources
- Minnesota 2035 Plan
- Minnesota Stroke Program
- About Us
Learn More
Related Topics
Cardiovascular Health Indicator
Measure: Stroke Death Rate
| Indicator | Date of Most Recent Measure | Current Measure | Trend |
|---|---|---|---|
| Age-adjusted mortality rate due to stroke | 2021 | 34.5 per 100,000 |
Stable |
Overview
- Stroke is the fifth-leading cause of death in Minnesota, responsible for 4.6% of all deaths in 2021. This is a lower proportion of overall deaths than is typical, as COVID-19 became the third-leading cause of death in 2020.
- Minnesota’s stroke death rate is about 16% lower than the United States average in 2021, and is the 14th lowest of the fifty states and District of Columbia.
- In Minnesota, there are large disparities in deaths due to stroke. Asians/Pacific Islander, African-American/African-Born, and American Indian Minnesotans die at rates approximately 30-40% higher than Minnesotans overall. Latinx/Hispanic Minnesotans have the lowest stroke death rates. These disparities in deaths are rooted in historical inequities that have persisted in the United States and Minnesota for many years.
- Stroke deaths have been dropping for decades, but this trend has stalled, and may have reversed since 2007.
See Also:
Analysis
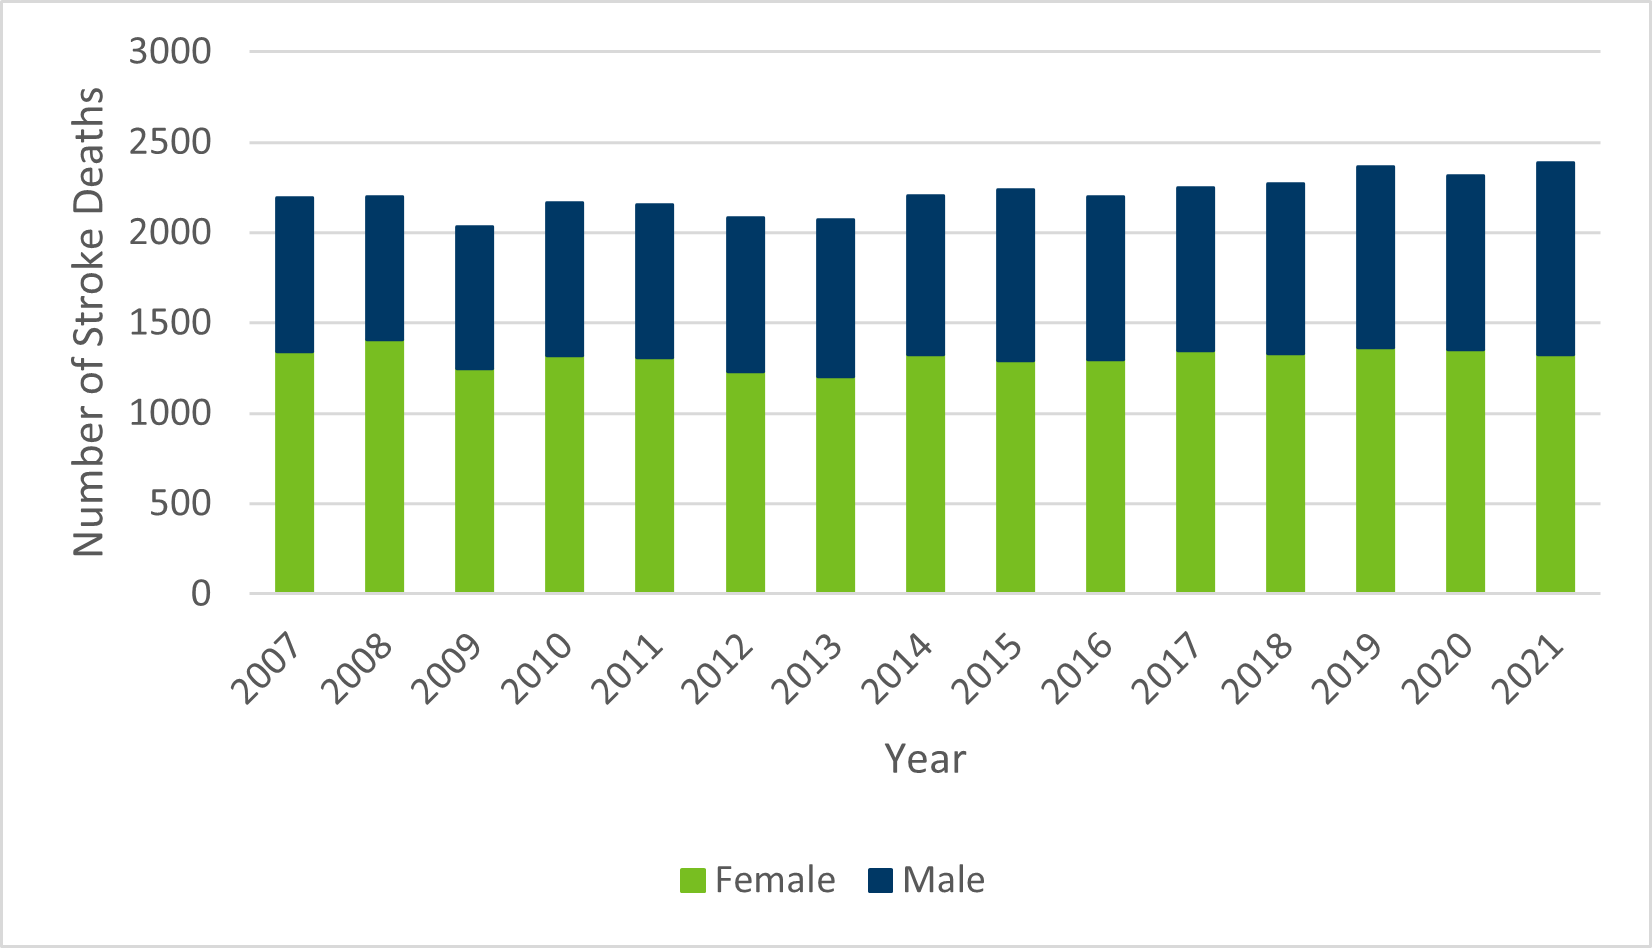
As shown in Table 1 below, the death rate due to stroke has declined since 2007, and it is now the fifth-leading cause of death in Minnesota. As recently as 2010, it was the third-leading cause of death in the state, but has fallen below Accidental Injury which has rising death rates. In addition, COVID-19 became the third-leading cause of death in 2020. The age-adjusted death rate for stroke for men and women is similar. More women die of stroke than men, but usually at an older age, which explains the similar death rate. Total stroke deaths were lowest in 2009 and have risen slightly in the years since. Chart 1 shows the pattern in total number of deaths and for women (green) and men (blue) since 2007. Even though the number of deaths has increased slightly, death rates have remained relatively stable. This can be explained by our aging population, with the number of older people who are at a risk of dying from stroke also increasing each year.
Table 1: Total Deaths and Death Rate due to Stroke for all Minnesotans and by sex, 2007-2021
| Year | Total Number of Deaths | Total Age-Adjusted Death Rate (per 100,000) | Number of Deaths, Females | Age-Adjusted Death Rate (per 100,000 Females) | Number of Deaths, Males | Age-Adjusted Death Rate (per 100,000 Males) |
|---|---|---|---|---|---|---|
| 2007 | 2,193 | 38.4 | 1,340 | 37.2 | 853 | 39.0 |
| 2008 | 2,199 | 37.7 | 1,407 | 38.5 | 792 | 35.6 |
| 2009 | 2,033 | 34.4 | 1,247 | 33.8 | 786 | 34.3 |
| 2010 | 2,167 | 36.1 | 1,319 | 35.3 | 848 | 36.3 |
| 2011 | 2,154 | 35.0 | 1,306 | 34.5 | 848 | 34.8 |
| 2012 | 2,081 | 33.0 | 1,232 | 31.5 | 849 | 34.0 |
| 2013 | 2,073 | 32.0 | 1,203 | 30.2 | 870 | 33.8 |
| 2014 | 2,202 | 34.0 | 1,325 | 33.8 | 877 | 33.6 |
| 2015 | 2,238 | 33.5 | 1,293 | 32.1 | 945 | 35.0 |
| 2016 | 2,197 | 32.5 | 1,298 | 31.7 | 899 | 32.6 |
| 2017 | 2,250 | 32.6 | 1,349 | 32.7 | 901 | 31.9 |
| 2018 | 2,270 | 32.2 | 1,329 | 31.8 | 941 | 32.1 |
| 2019 | 2,365 | 33.0 | 1,364 | 32.2 | 1,001 | 33.2 |
| 2020 | 2,315 | 32.1 | 1,353 | 32.1 | 962 | 31.7 |
| 2021 | 2,384 | 34.5 | 1,326 | 33.1 | 1,058 | 35.5 |
Chart 1: Total Deaths due to Stroke for all Minnesotans and by sex, 2007-2021
Despite Minnesota’s overall lower stroke death rate compared to the United States (16% lower in 2021), there are large disparities in the state. As shown in Chart 2 and Table 2, the death rate due to stroke is highest in Asian/Pacific Islander, African American/African-Born, and American Indian communities in Minnesota and lowest in Latinx/Hispanic communities. The last column of Table 2 shows a rate ratio, which compares two rates to describe how much one group is impacted compared to another. Any number larger than 1 means that the group of interest is higher than the comparison group. Any number smaller than 1 means the group of interest is lower than the comparison group. Asians/Pacific Islander, African American/African Born, and American Indian Minnesotans die from stroke at rates approximately 30-40% higher than Minnesotans overall. Stroke death rates for Latinx/Hispanic Minnesotans are 50% lower than the Minnesota average. These disparities in deaths are rooted in historical inequities that have persisted in the United States and Minnesota for many years.
Chart 2: Death Rate due to Stroke by Race and Ethnicity, 2018-2021
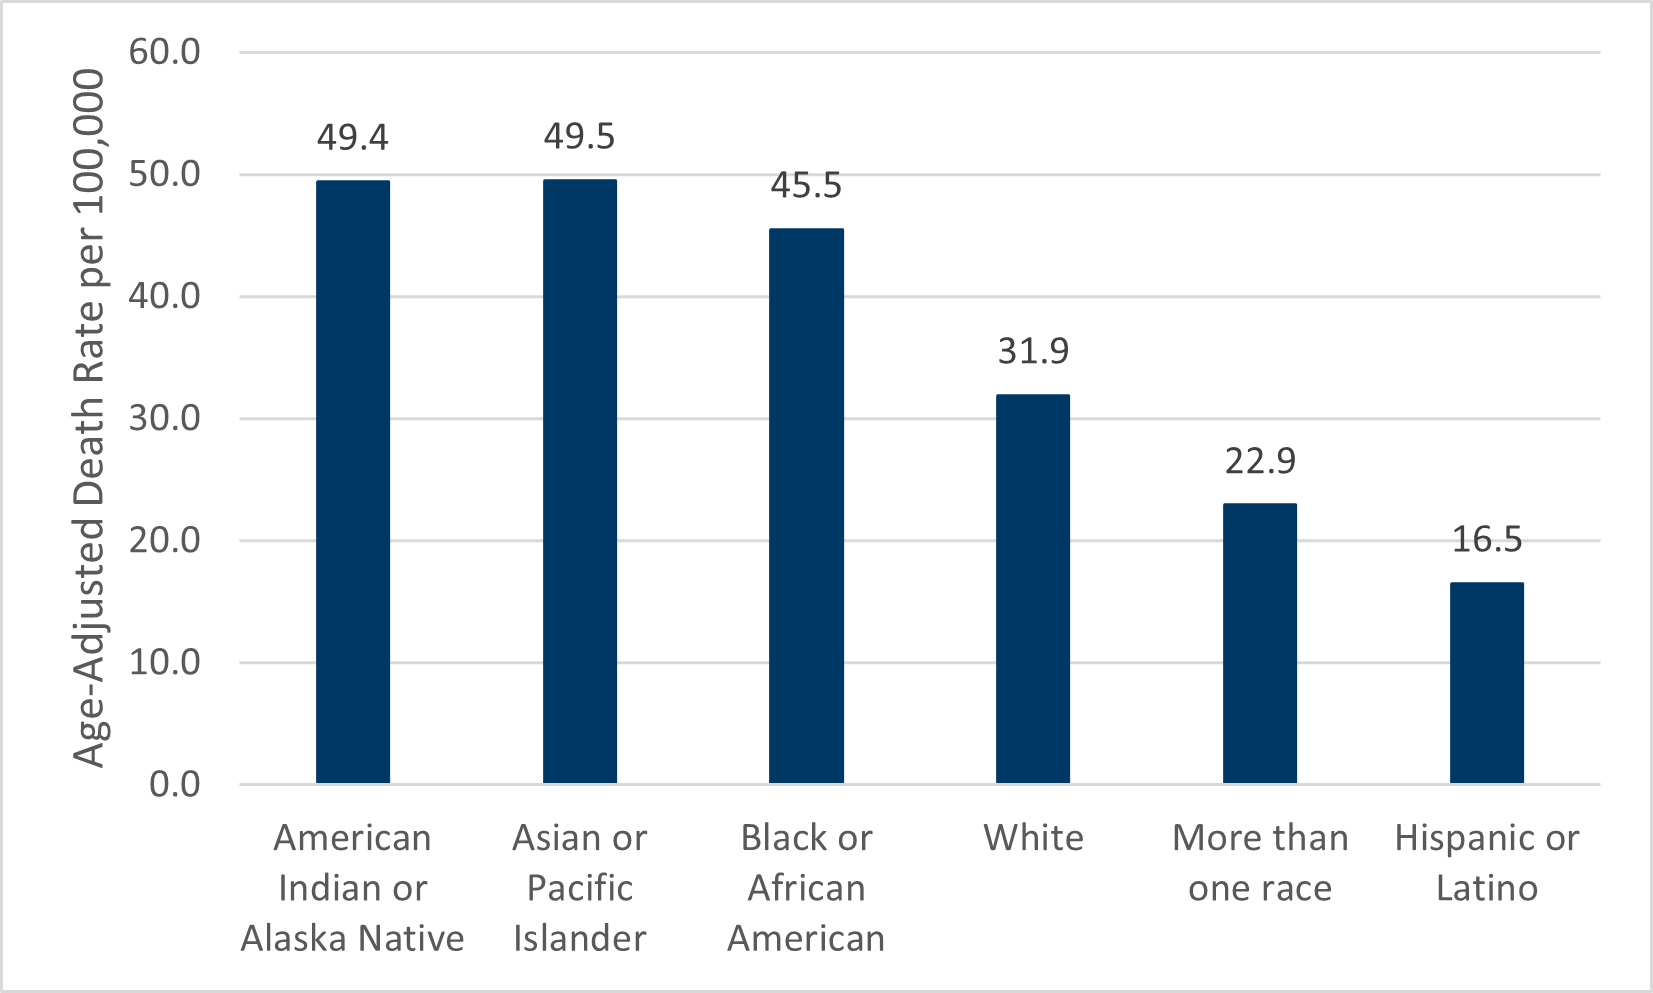
Table 2: Total Deaths and Death Rate due to Stroke by Race and Ethnicity, 2018-2021
| Race/Ethnicity | Total Deaths, 2018-2021 | Annual Age-Adjusted Death Rate (per 100,000), 2018-2021 | Rate Ratio, compared to Minnesota rate |
|---|---|---|---|
| All Minnesotans | 9,334 | 32.9 | - |
| American Indian or Alaska Native | 88 | 49.4 | 1.50 |
| Asian or Pacific Islander | 312 | 49.5 | 1.50 |
| Black or African American | 347 | 45.5 | 1.38 |
| White | 8,480 | 31.9 | 0.97 |
| More than one race | 30 | 22.9 | 0.70 |
| Hispanic or Latino | 67 | 16.5 | 0.50 |
*The method for categorizing people by race changed in 2021. Comparison to data from prior dashboard releases is not recommended.
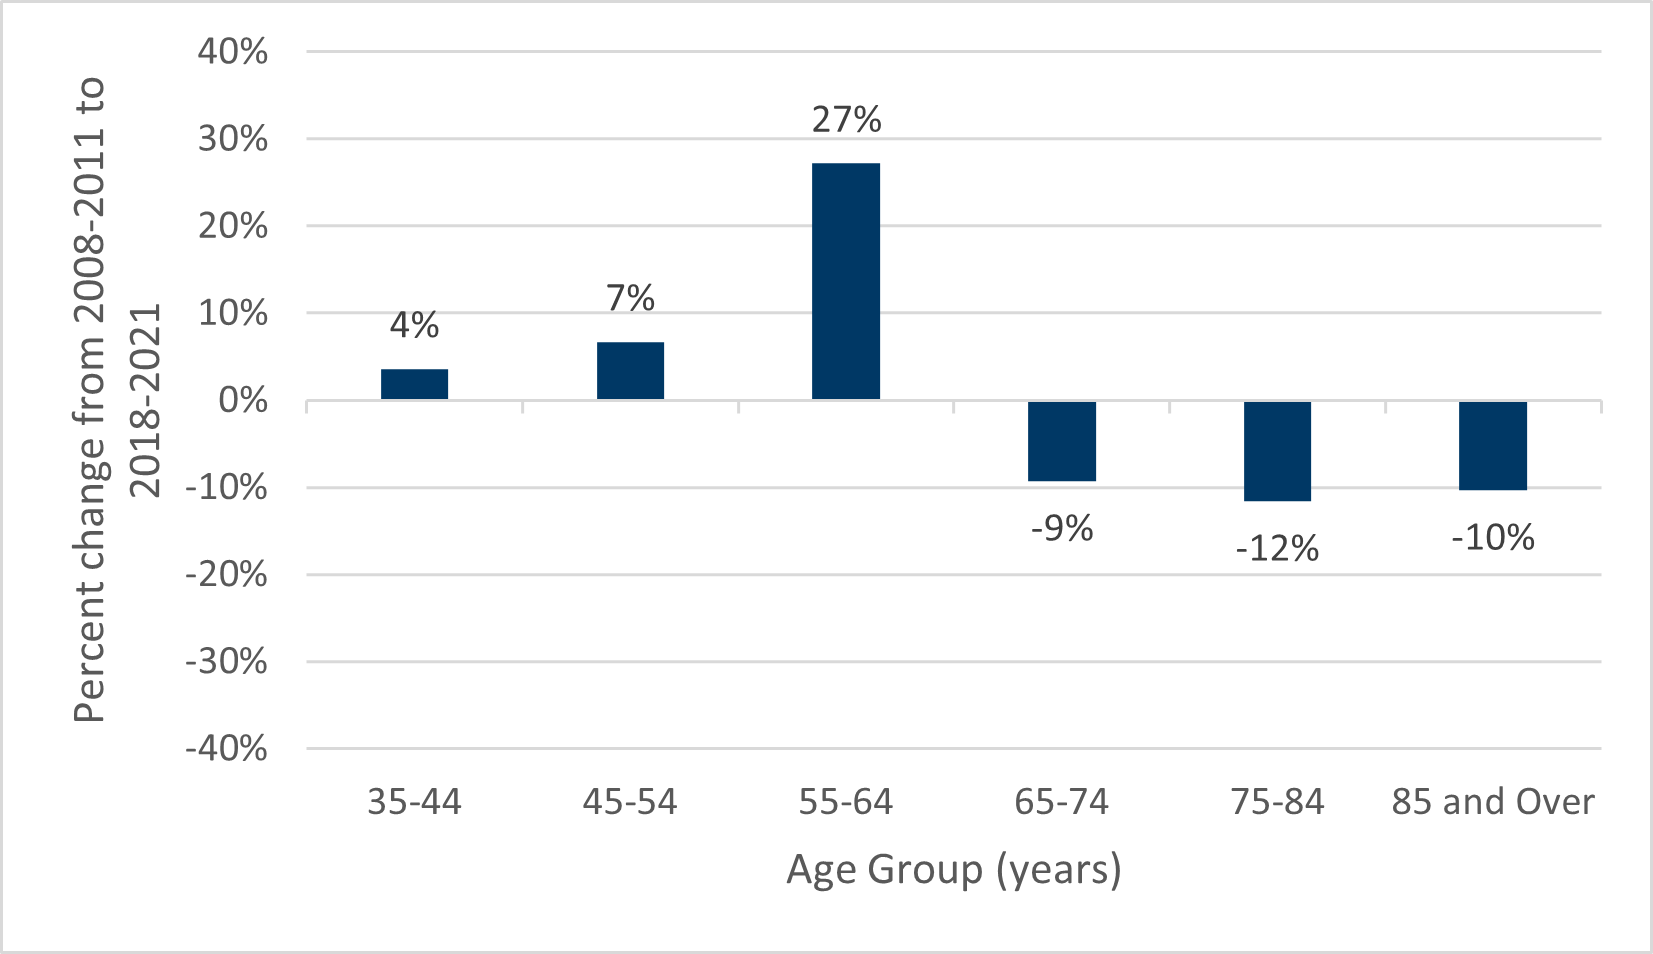
The number of deaths due to stroke increases in older age groups. Table 3 shows the number of deaths and death rate due to stroke between 2008-2011 and 2018-2021. Over that period, the largest declines in death rates have been for Minnesotans aged 65 and older, as shown in Chart 3. For Minnesotans aged 35-54 there have been small increases in death rates, while for Minnesotans ages 55-64, death rates have increased by more than 25%.
Table 3: Total Deaths and Death Rate due to Stroke by Age Group, 2008-2021
| Age Group (years) | Number of Deaths 2008-2011 | Crude Death Rate (per 100,000), 2008-2011 | Number of Deaths, 2018-2021 | Crude Death Rate (per 100,000), 2018-2021 | Change over 10 years |
|---|---|---|---|---|---|
| 35-44 | 78 | 2.8 | 84 | 2.9 | 4% |
| 45-54 | 290 | 9 | 257 | 9.6 | 7% |
| 55-64 | 456 | 18.4 | 706 | 23.4 | 27% |
| 65-74 | 940 | 67.1 | 1,321 | 60.9 | -9% |
| 75-84 | 2,333 | 262.3 | 2,476 | 232 | -12% |
| 85 and Over | 4,401 | 1,034.9 | 4,428 | 928.4 | -10% |
Chart 3: Percent change in Death Rate due to Stroke by Age Group, from 2008-2011 to 2018-2021