Work-Related Injuries and Illnesses
This indicator tracks work-related injuries or illnesses. Examples of work-related injuries include falls, burns, being struck or crushed, fractures, electric shocks, cuts, amputations, needle-sticks, and assaults. Examples of work-related illnesses include contact dermatitis, asthma, some types of cancer, asbestosis, carpal-tunnel syndrome, frostbite, and hearing loss. Injuries and illnesses prevent an employee from participating in normal activities and adversely impact the employee, the employee’s family, and the employer. Work related injuries and illnesses are preventable with proper training and control of occupational hazards.
This indicator provides health and safety professionals with information about rates and trends of injuries and illnesses in the state of Minnesota. This information may be useful in identifying higher risk industries and occupations, setting priorities for prevention efforts, and evaluating effectiveness of intervention programs.
Total Number of work-related injuries and illnesses
Data Source: Bureau of Labor Statistics Survey of Occupational Injuries and Illnesses (SOII)
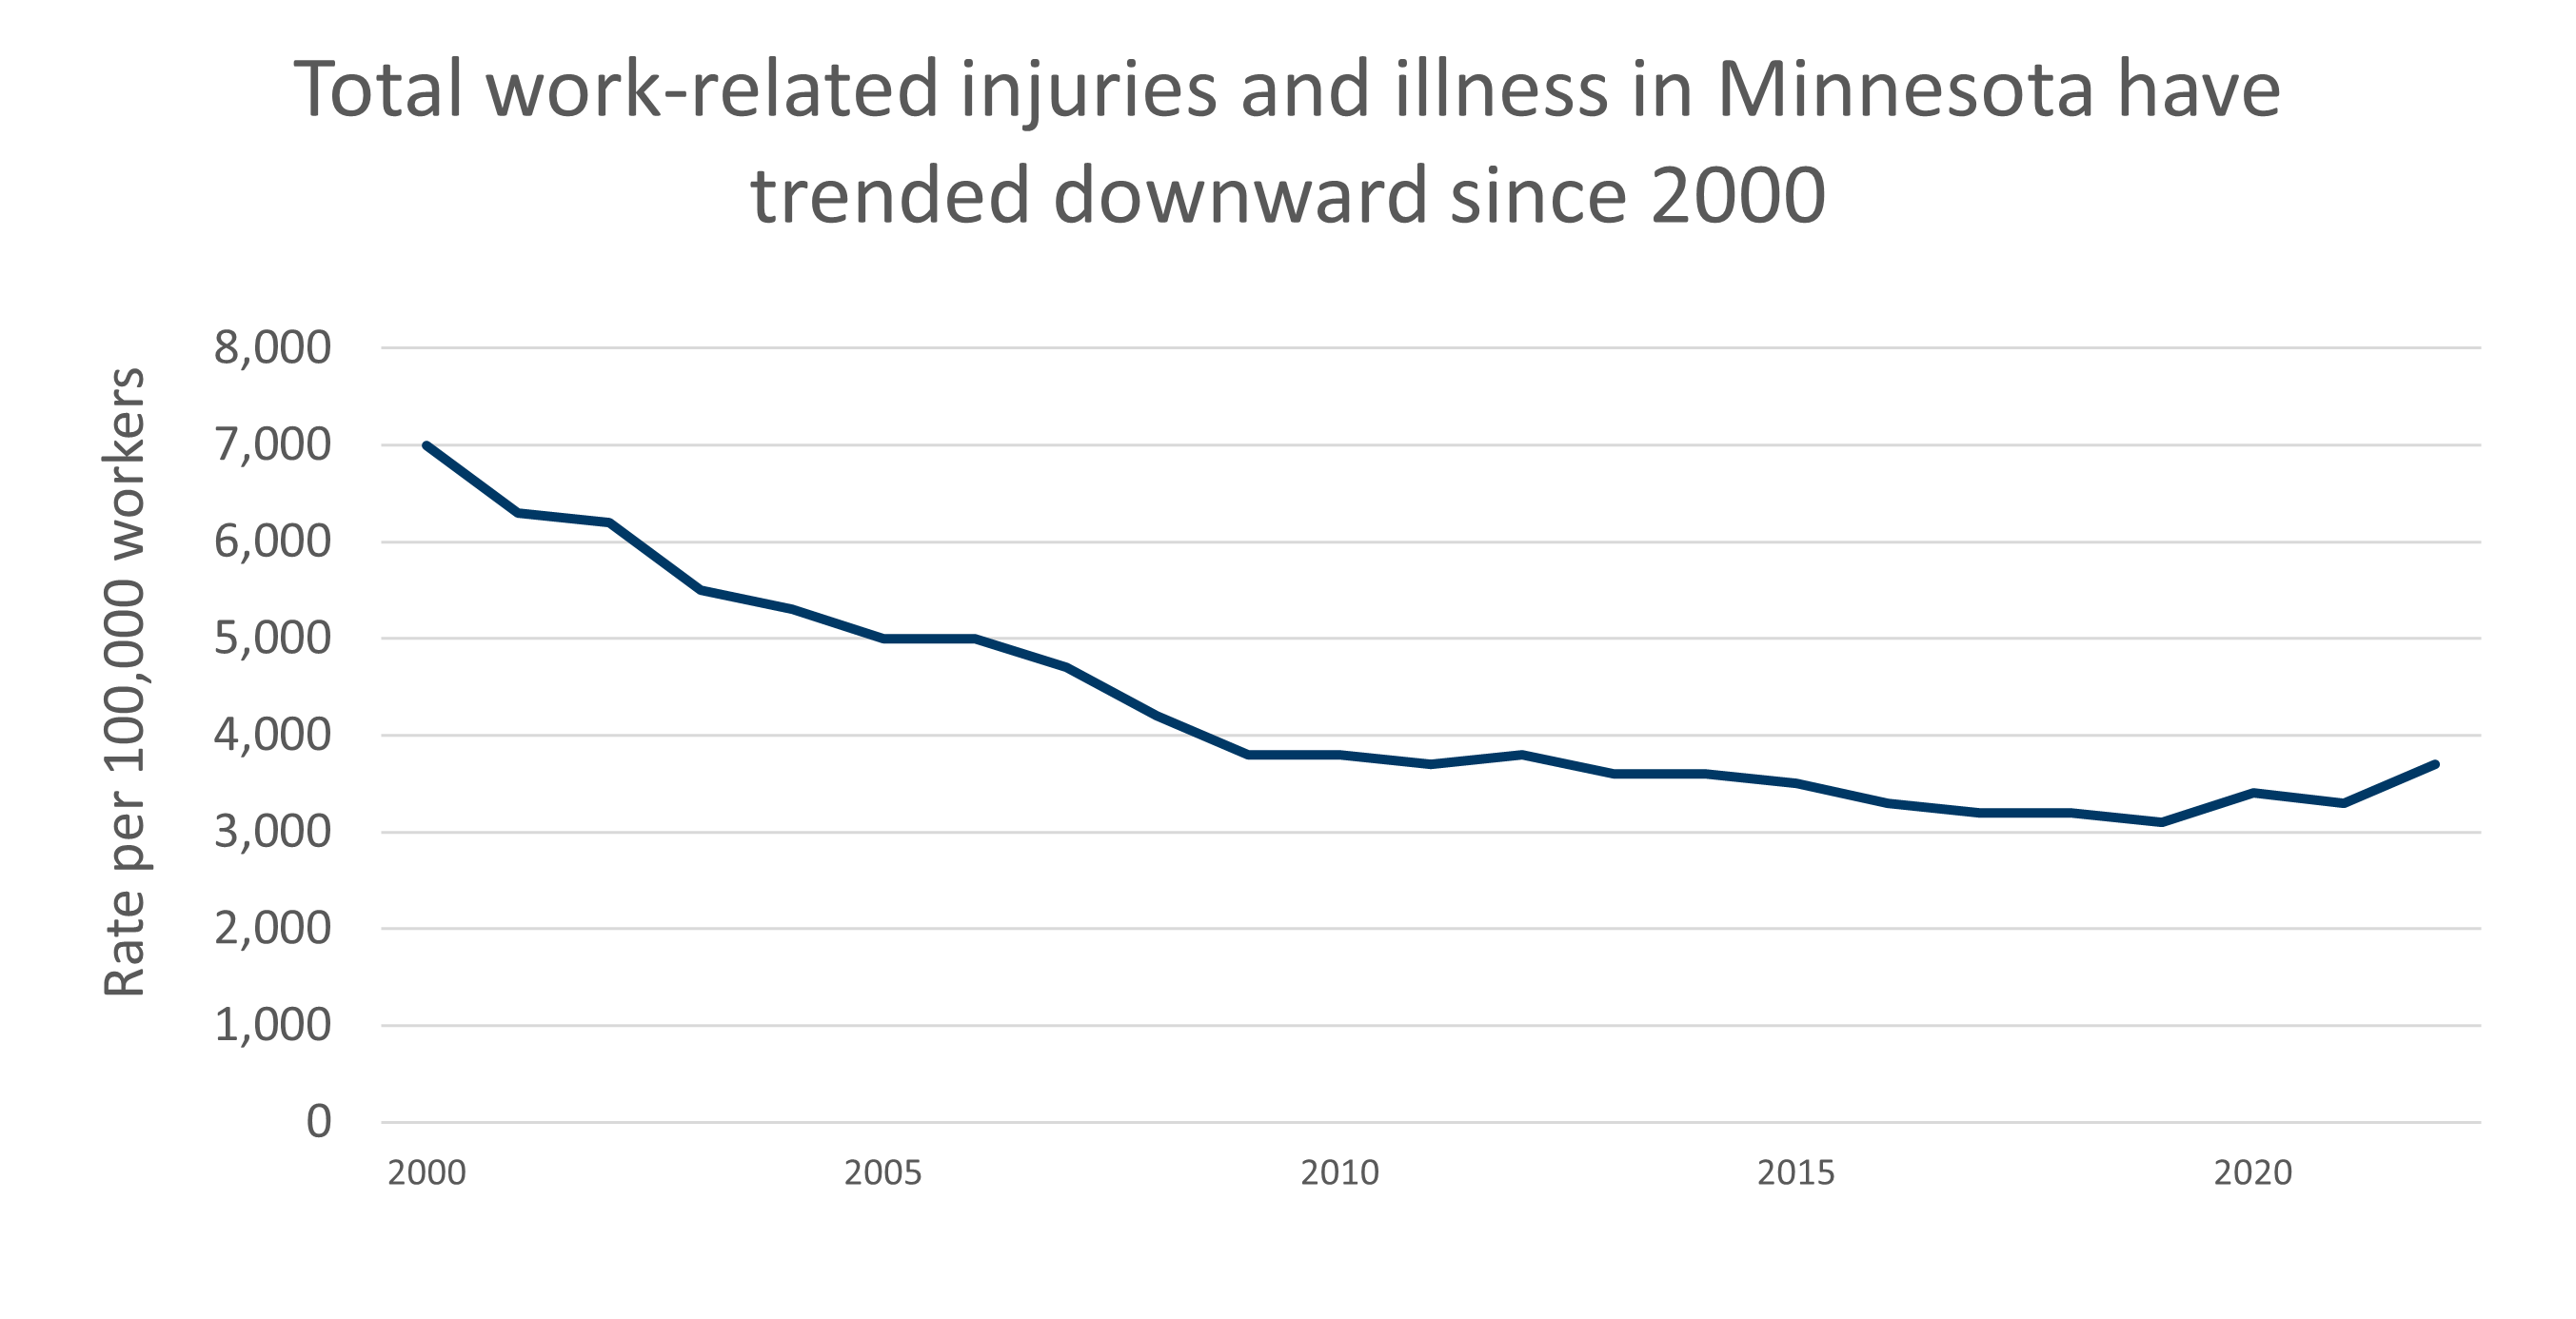
Total work-related injuries and illnesses:
Using national survey data, the number and rate of work-related injuries and illnesses in Minnesota has generally declined from 2000. However, the trend has flattened in recent years and was higher in 2022 than recent years. Data are from the Bureau of Labor Statistics Survey of Occupational Injuries and Illnesses (SOII). This survey uses information reported by employers, thus is dependent on the accuracy and completeness of their reporting. Therefore, the true number and rate of injuries and illnesses is likely to be somewhat higher.
Work-related injuries and illnesses involving days away from work.
Data Source: Bureau of Labor Statistics Survey of Occupational Injuries and Illnesses (SOII)
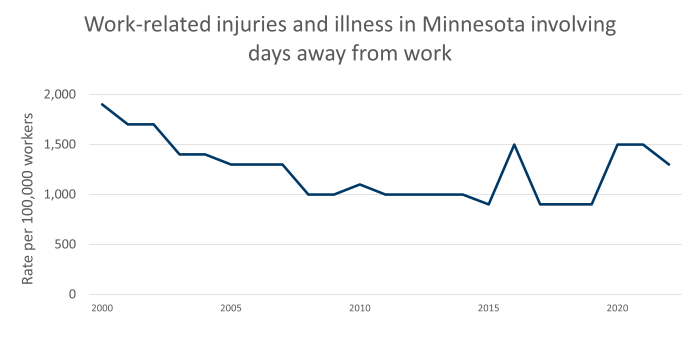
Injury and illness cases involving days away from work:
Using national survey data, the number and rate of work-related injury and illness cases in Minnesota involving days away from work declined from 2000 to 2019. However, these were higher in 2020 through 2022. Data are from the Bureau of Labor Statistics Survey of Occupational Injuries and Illnesses (SOII). This survey uses information reported by employers, thus is dependent on the accuracy and completeness of their reporting. Therefore, the true number and rate of injuries and illnesses is likely to be somewhat higher.
Hospitalizations
Data Source, Numerator: Inpatient hospital discharge data, Minnesota Hospital Association
Data Source, Denominator: Bureau of Labor Statistics Geographic Profiles of Employment and Unemployment
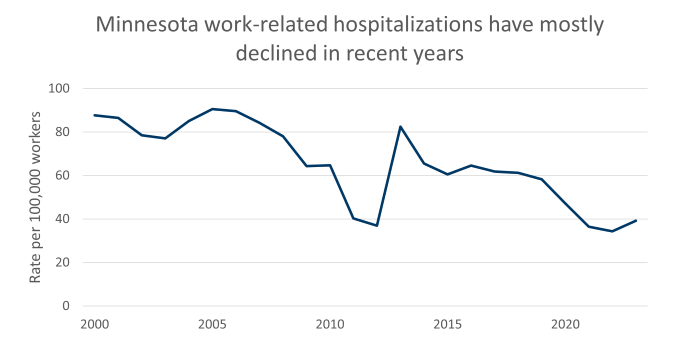
Work-related hospitalizations:
The number of hospitalizations is from hospital discharge data provided by the Minnesota Hospital Association. Inpatient discharges with workers’ compensation as the payer are included. Denominator data are from the Bureau of Labor Statistics Geographic Profile of Employment and Unemployment, which summarizes findings from the Current Population Survey, an ongoing joint survey conducted by the Census Bureau and the Bureau of Labor Statistics. Current Population Survey (CPS). Although the numbers have fluctuated, the general trend is toward fewer work-related hospitalizations per year.
Traumatic fatalities
Data Source, Numerator: Bureau of Labor Statistics Census of Fatal Occupational Injuries
Data Source, Denominator: NIOSH Employed Labor Force query system
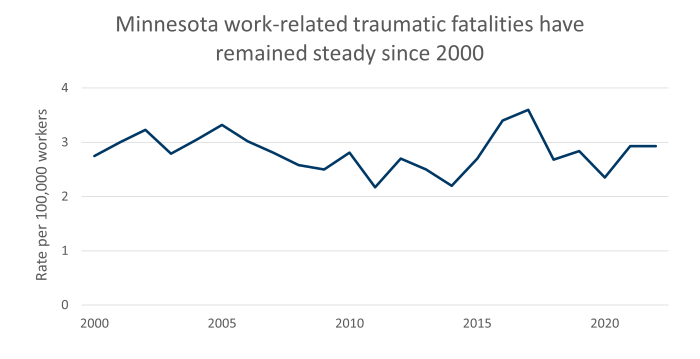
Work-related traumatic fatalities:
Numerator data are from the Bureau of Labor Statistics (BLS) Census of Fatal Occupational Injuries (CFOI). The denominator is from the NIOSH Employed Labor Force Query System, which includes a subset of the BLS Current Population Survey. These surveys use information reported by employers, thus are dependent on the accuracy and completeness of their reporting. Therefore, the true number and rate of work-related traumatic fatalities may be higher.
Traumatic injury hospitalizations
Data Source, Numerator: Inpatient hospital discharge data, Minnesota Hospital Association
Data Source, Denominator: Bureau of Labor Statistics Geographic Profiles of Employment and Unemployment
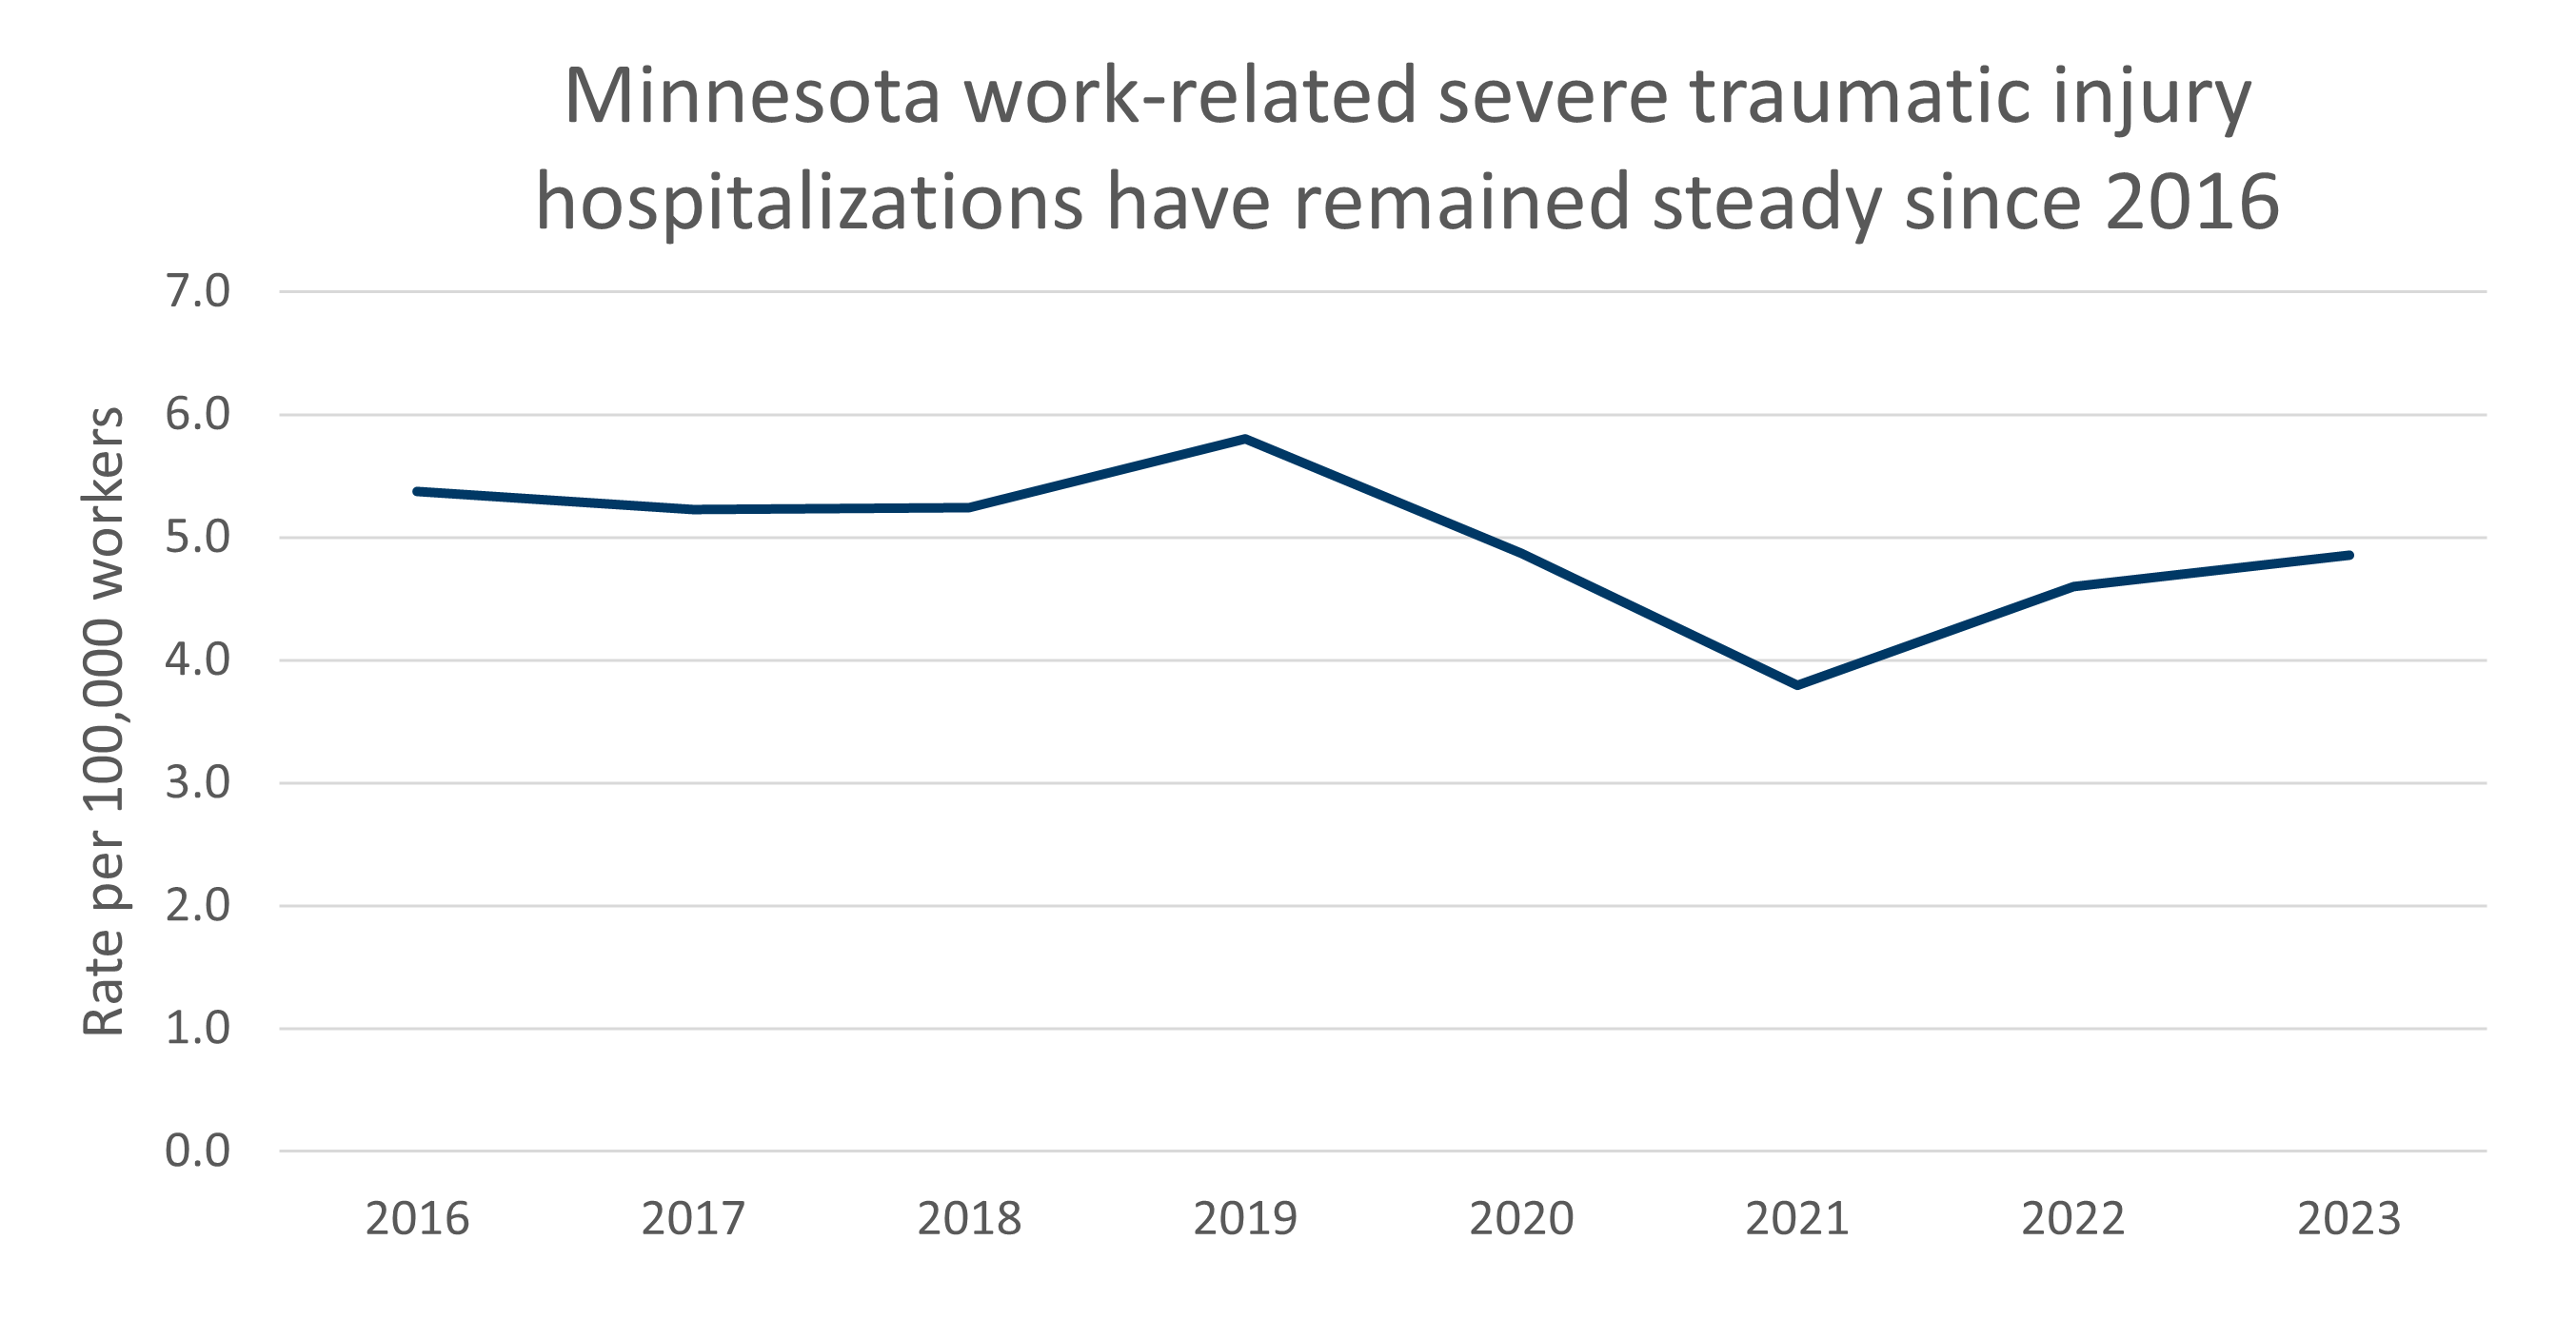
Work-related severe traumatic injury hospitalizations:
The number of hospitalizations is from hospital discharge data provided by the Minnesota Hospital Association. Inpatient discharges with workers’ compensation as the payer are included. Denominator data are from the Bureau of Labor Statistics Geographic Profile of Employment and Unemployment, which summarizes findings from the Current Population Survey, an ongoing joint survey conducted by the Census Bureau and the Bureau of Labor Statistics. Current Population Survey (CPS). Although the numbers have fluctuated, the general trend is toward fewer work-related severe traumatic injury hospitalizations per year.
Burn hospitalizations
Data Source, Numerator: Inpatient hospital discharge data, Minnesota Hospital Association
Data Source, Denominator: Bureau of Labor Statistics Geographic Profiles of Employment and Unemployment
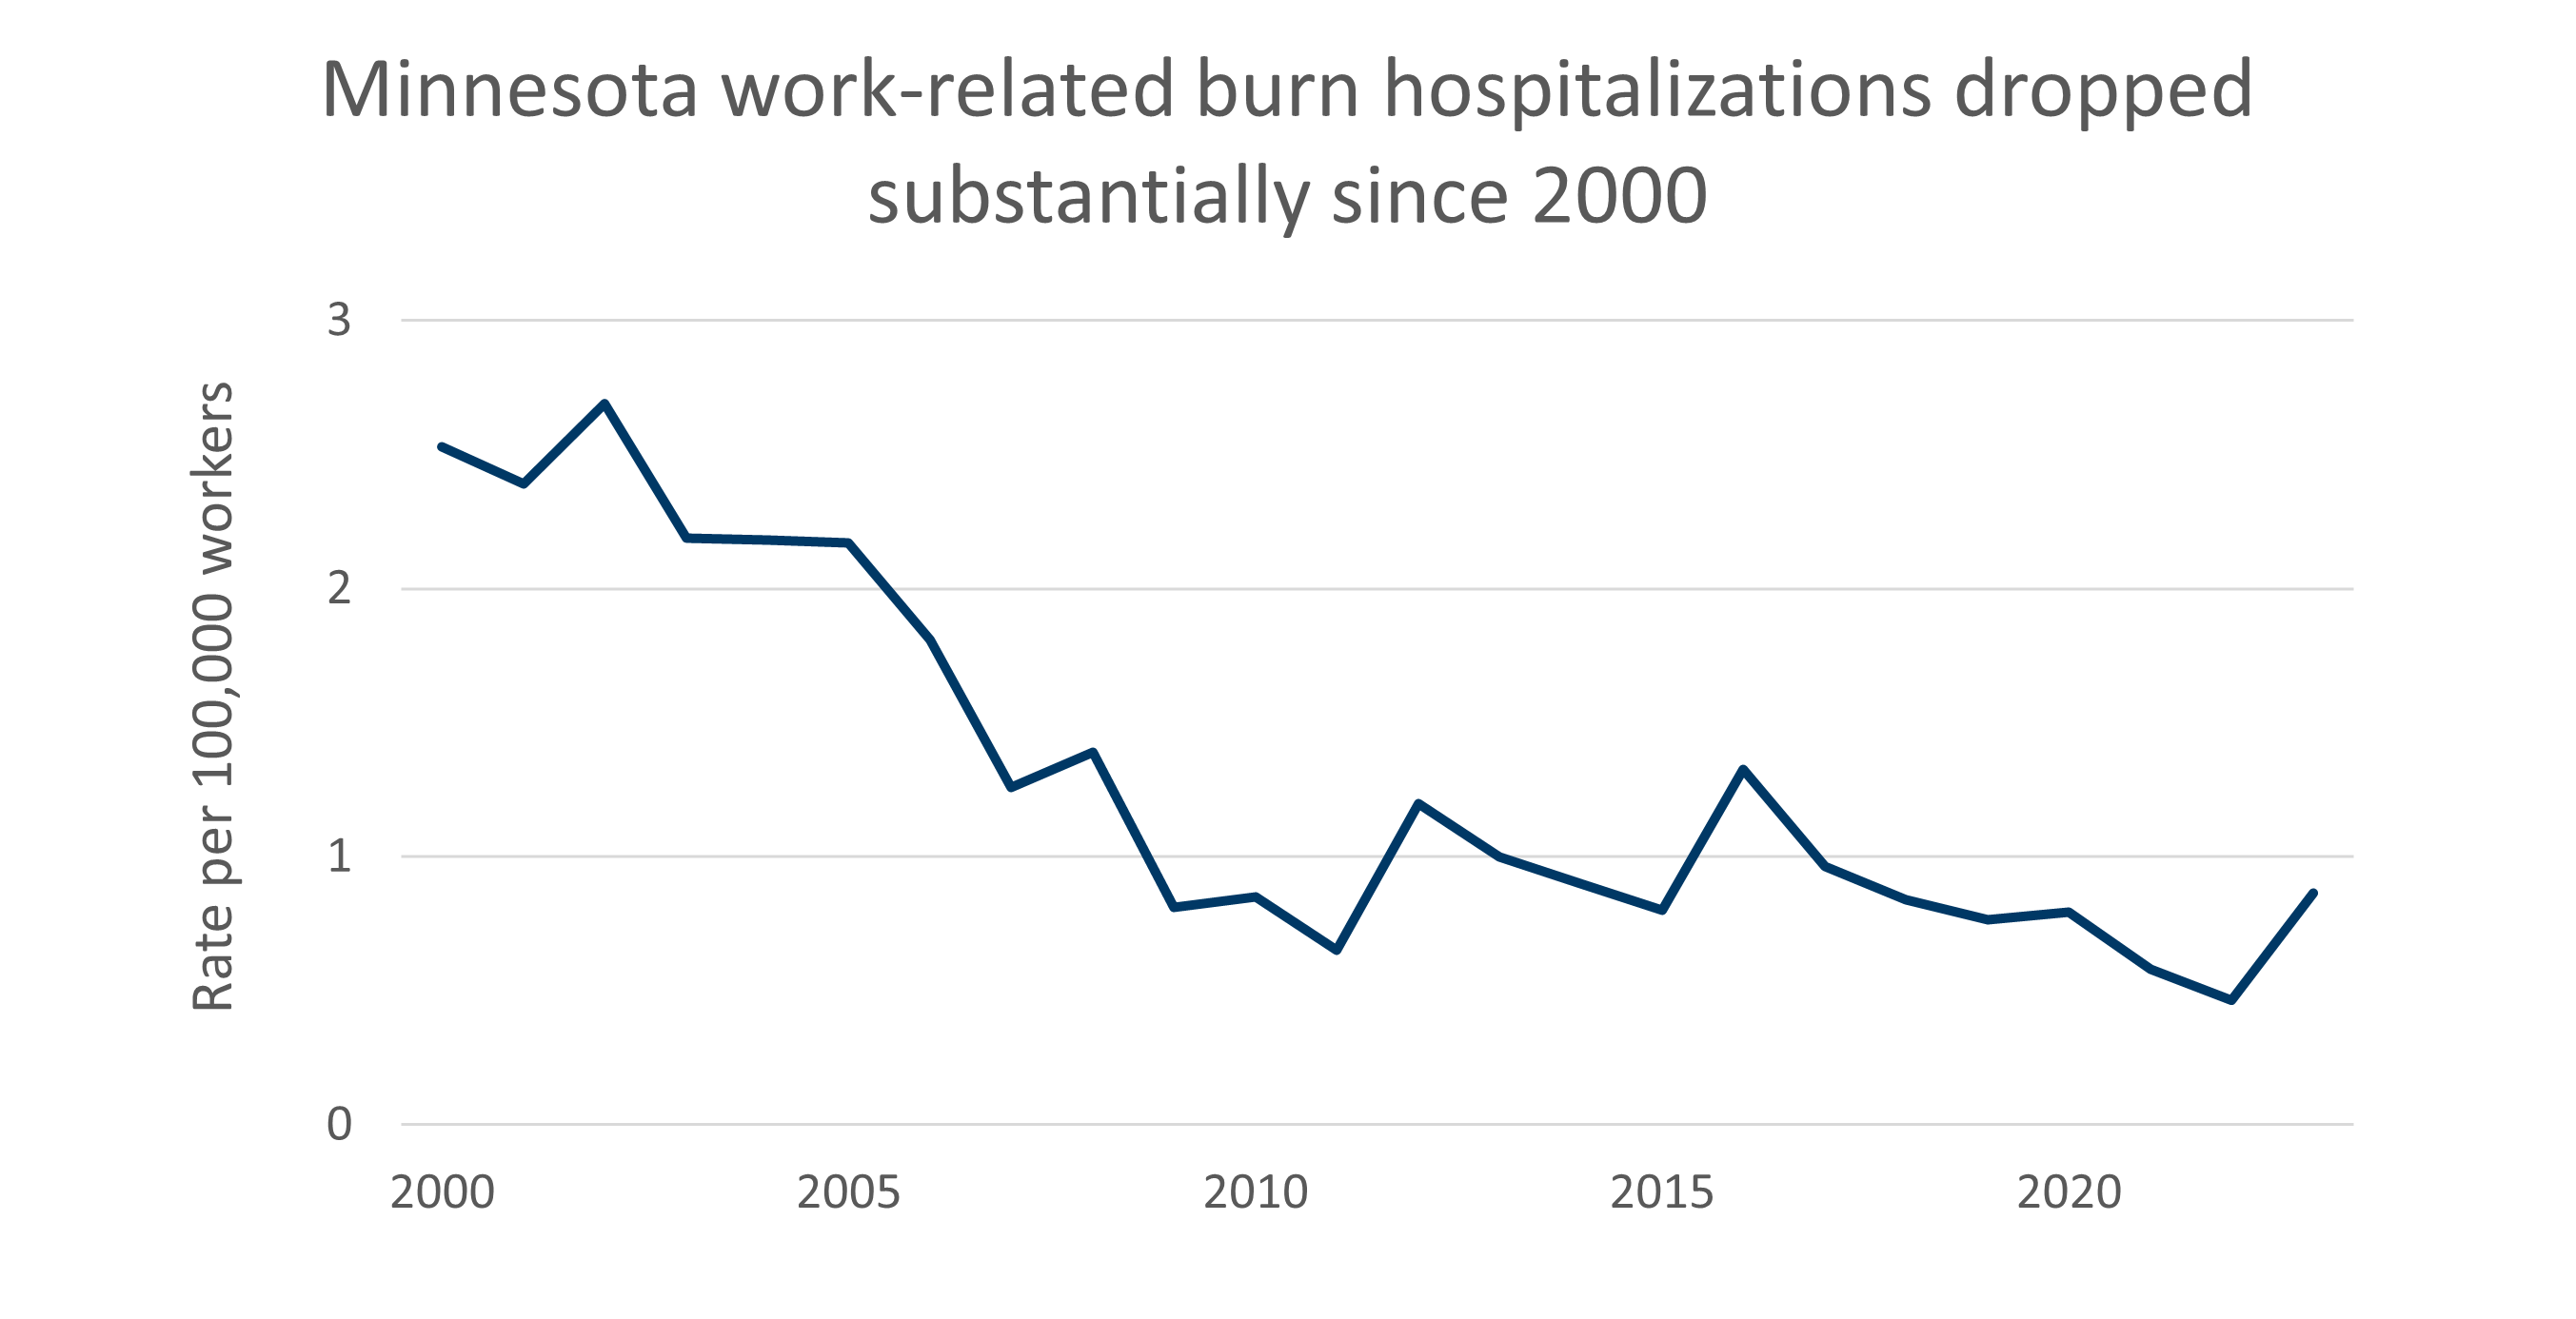
Work-related burn hospitalizations:
The number of hospitalizations is from hospital discharge data provided by the Minnesota Hospital Association. Inpatient discharges with workers’ compensation as the payer are included. Denominator data are from the Bureau of Labor Statistics Geographic Profile of Employment and Unemployment, which summarizes findings from the Current Population Survey, an ongoing joint survey conducted by the Census Bureau and the Bureau of Labor Statistics. Current Population Survey (CPS). There has been a significant reduction in work-related burn hospitalizations per year since 2000.
Heat-related emergency visits
Data Source, Numerator: Outpatient (emergency department) hospital discharge data, Minnesota Hospital Association
Data Source, Denominator: Bureau of Labor Statistics Geographic Profiles of Employment and Unemployment
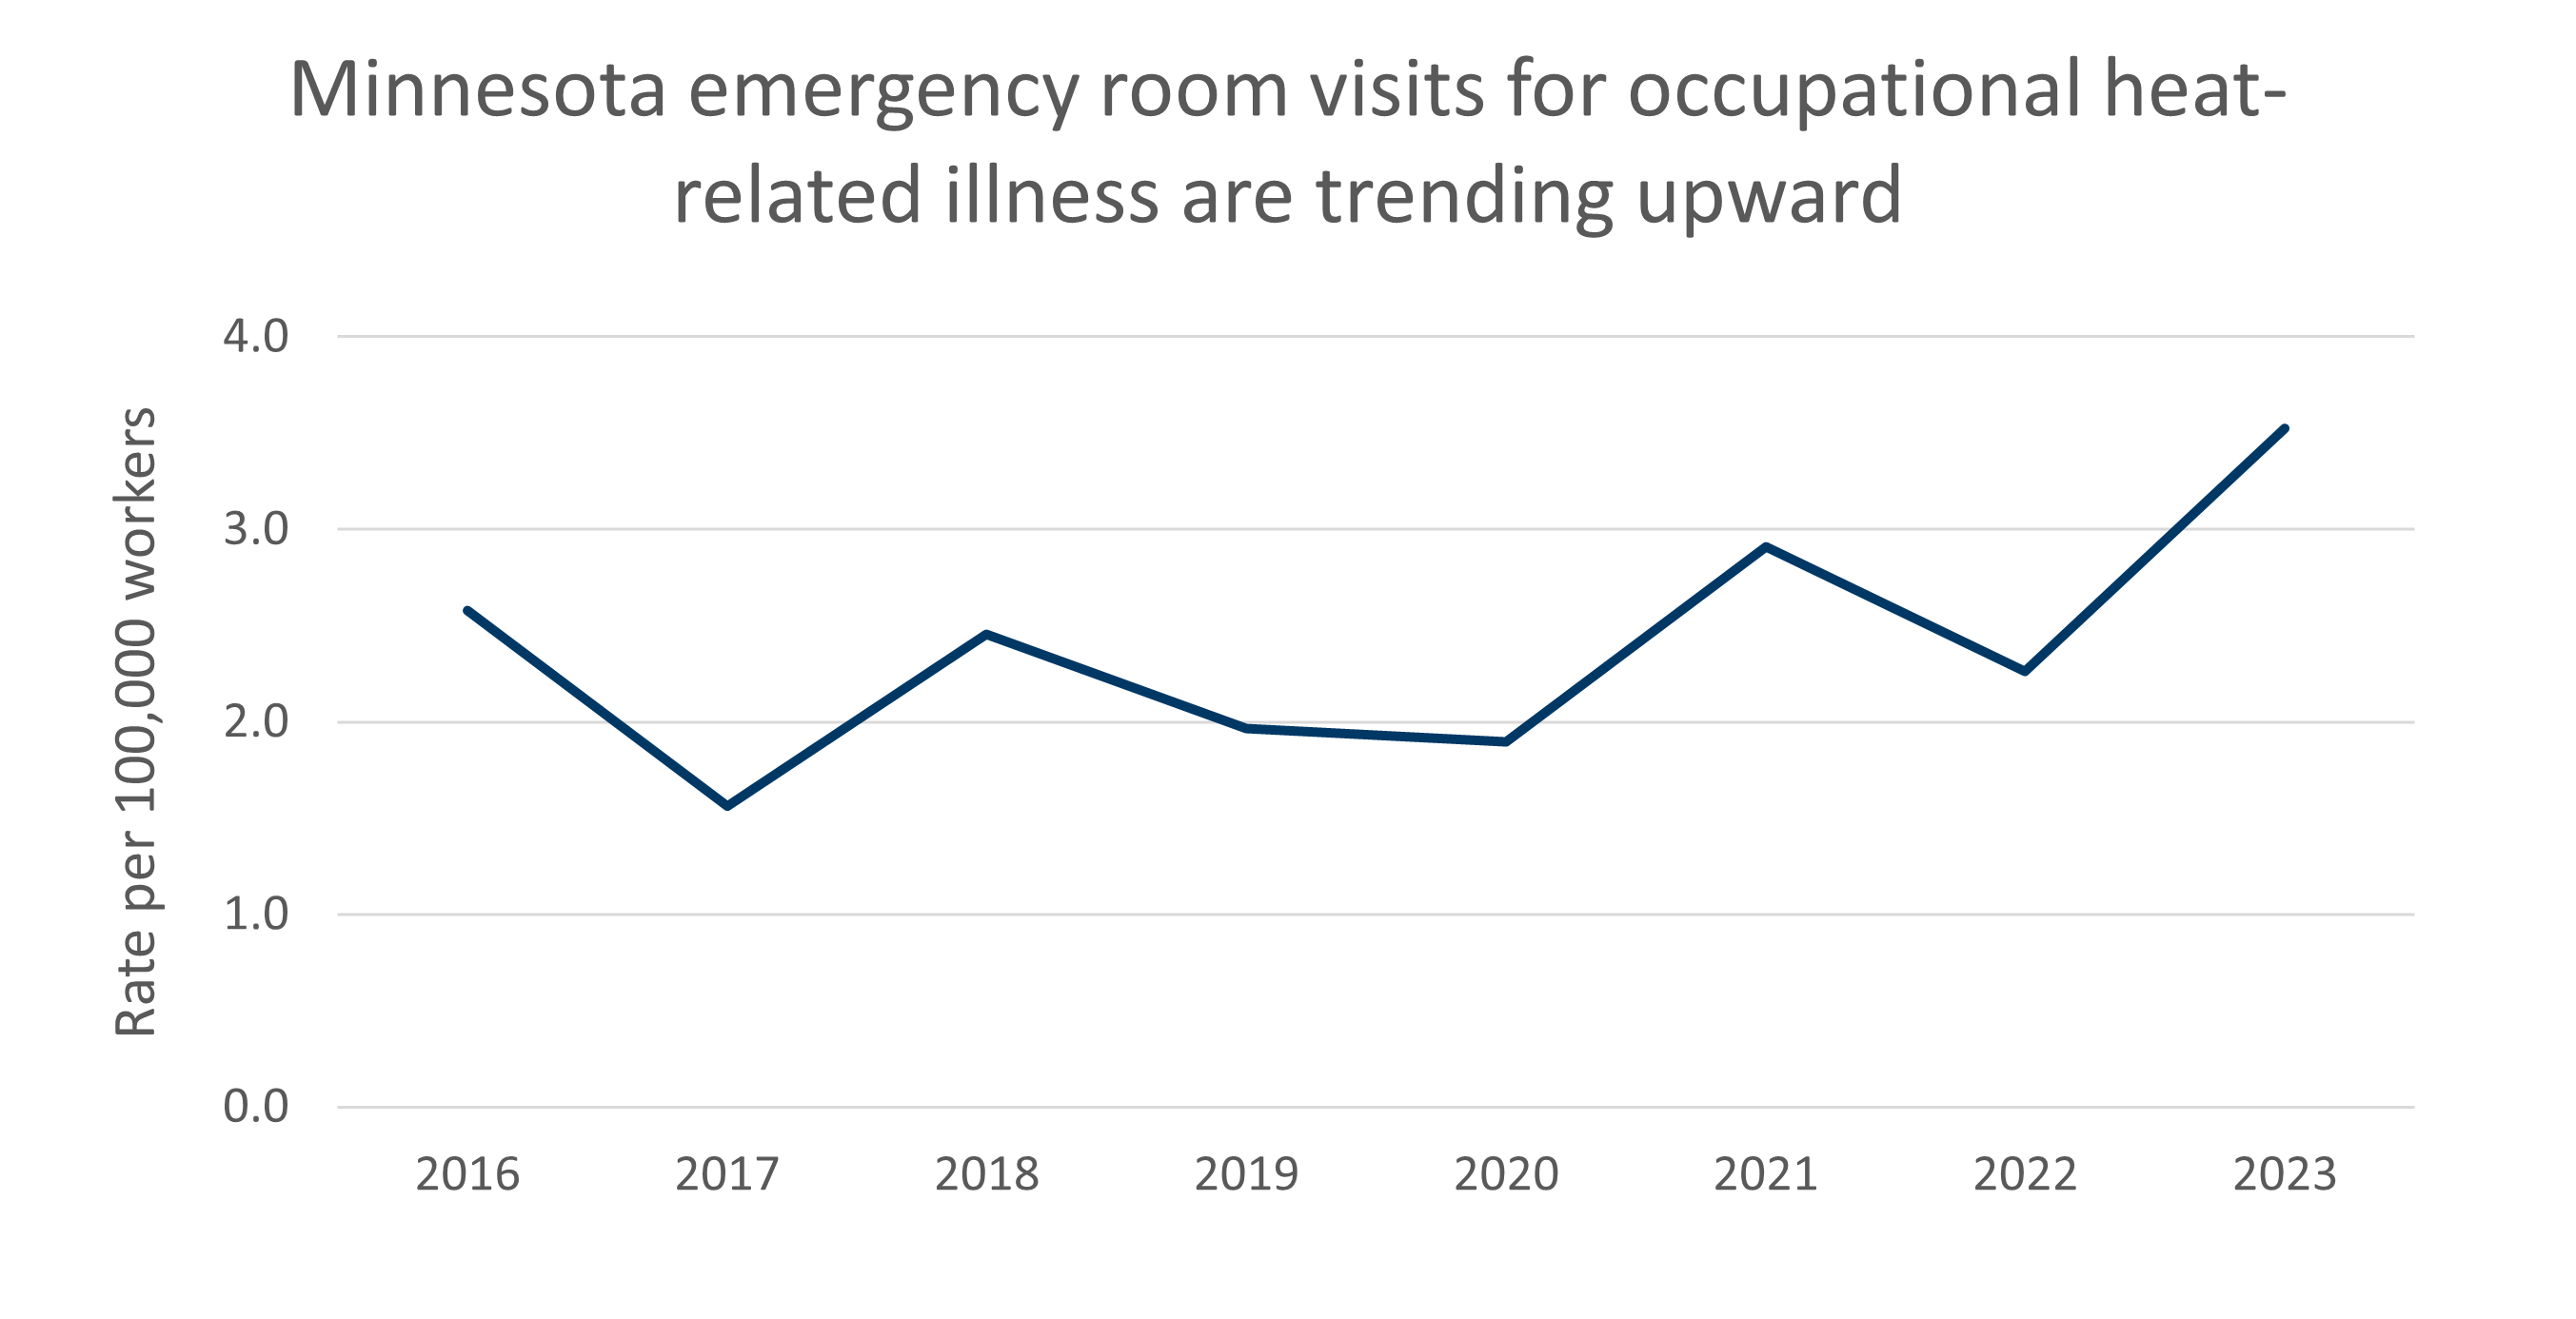
Emergency room visits for occupational heat-related illness:
The number of hospitalizations is from hospital discharge data provided by the Minnesota Hospital Association. Outpatient discharges with workers’ compensation as the payer are included. Denominator data are from the Bureau of Labor Statistics Geographic Profile of Employment and Unemployment, which summarizes findings from the Current Population Survey, an ongoing joint survey conducted by the Census Bureau and the Bureau of Labor Statistics. Current Population Survey (CPS). In recent years there has been an increase in the number of emergency room visits for occupational heat-related illness per year.
Amputations
Data Source, Numerator: Workers’ compensation data from MN Department of Labor and Industry
Data Source, Denominator: National Academy of Social Insurance estimate of workers covered by workers’ compensation
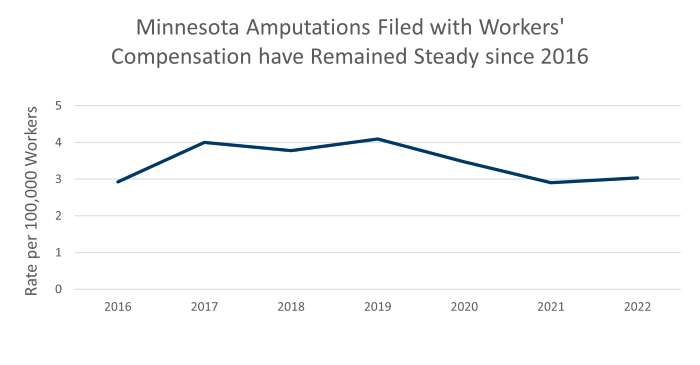
Amputations filed with workers' compensation:
Numerator data are from workers’ compensation claims data provided by the Minnesota Department of Labor and Industry. Denominator data are from the National Academy of Social Insurance estimate of workers covered by workers’ compensation. Amputations reported to workers’ compensation system have remained relatively stable since 2016.
Carpal tunnel syndrome
Data Source: Bureau of Labor Statistics Survey of Occupational Injuries and Illnesses (SOII)
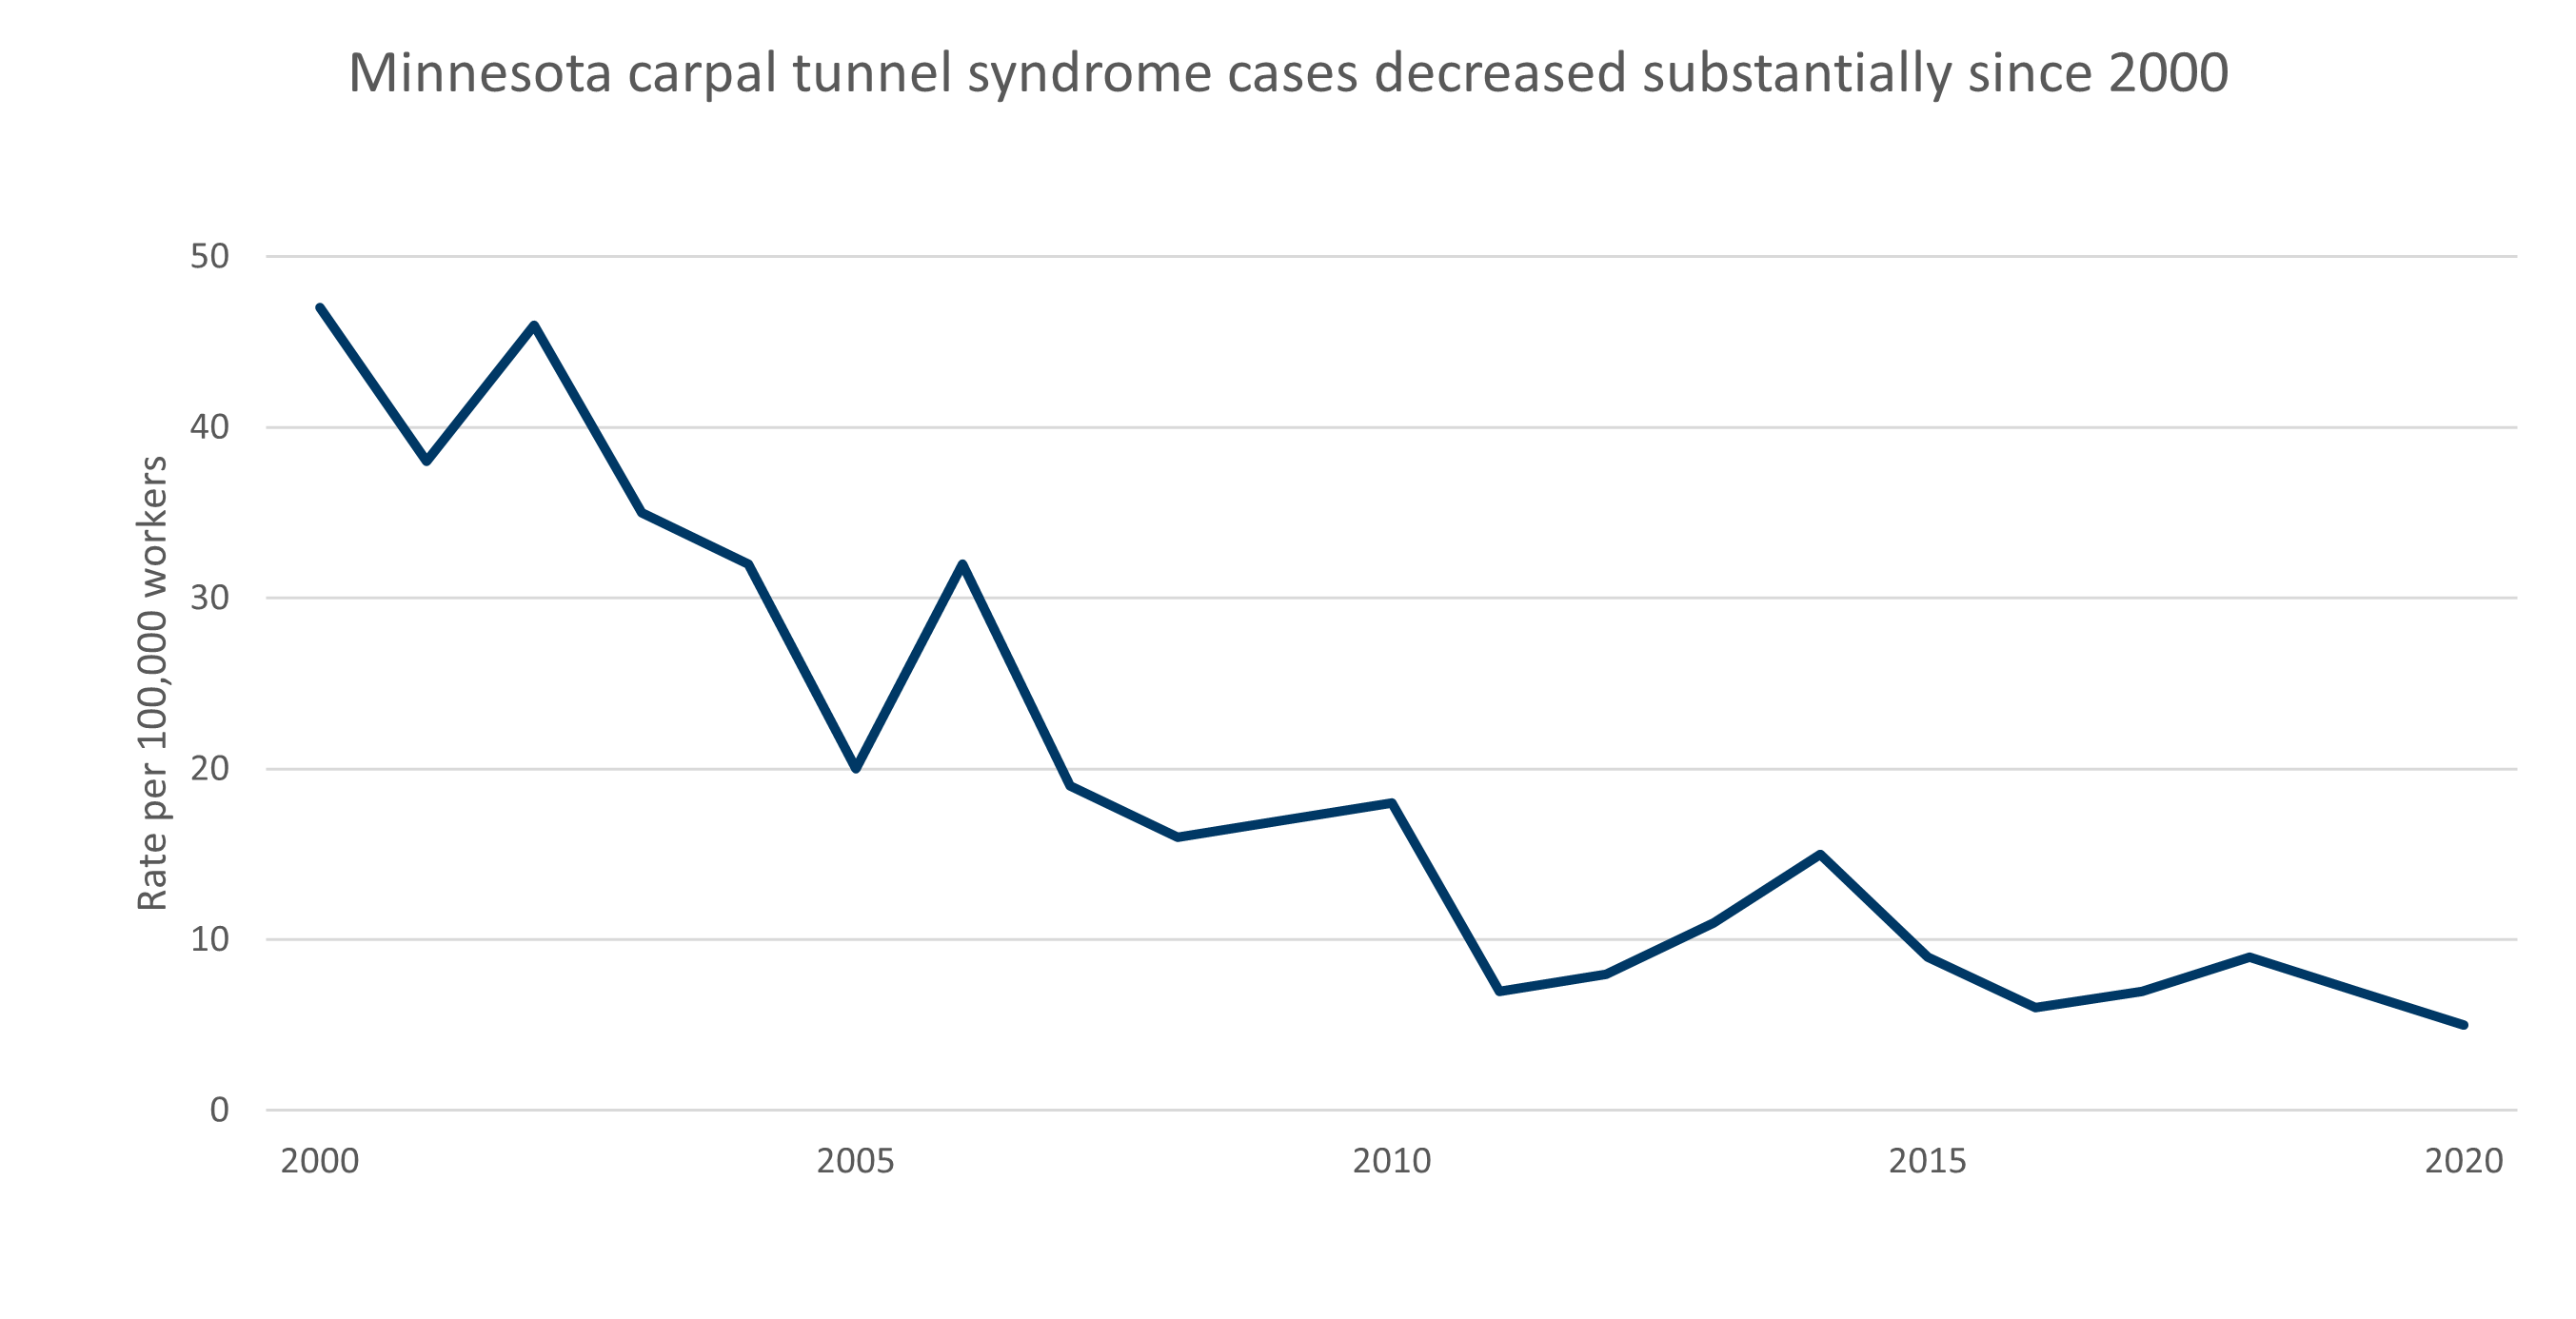
Carpel tunnel syndrome cases:
Using national survey data, the number and rate of work-related carpel tunnel syndrome cases has declined substantially from 2000. However, the trend has flattened in recent years. Data are from the Bureau of Labor Statistics Survey of Occupational Injuries and Illnesses (SOII). Beginning with 2021 data, the BLS has changed to biennial collection of these data. Therefore, annual data are currently only available through 2020. The SOII uses information reported by employers, thus is dependent on the accuracy and completeness of their reporting. Therefore, the true number and rate of injuries and illnesses is likely to be somewhat higher.
Carpal tunnel cases
Data Source, Numerator: Workers’ compensation data from Minnesota Department of Labor and Industry
Data Source, Denominator: National Academy of Social Insurance estimate of workers covered by workers’ compensation
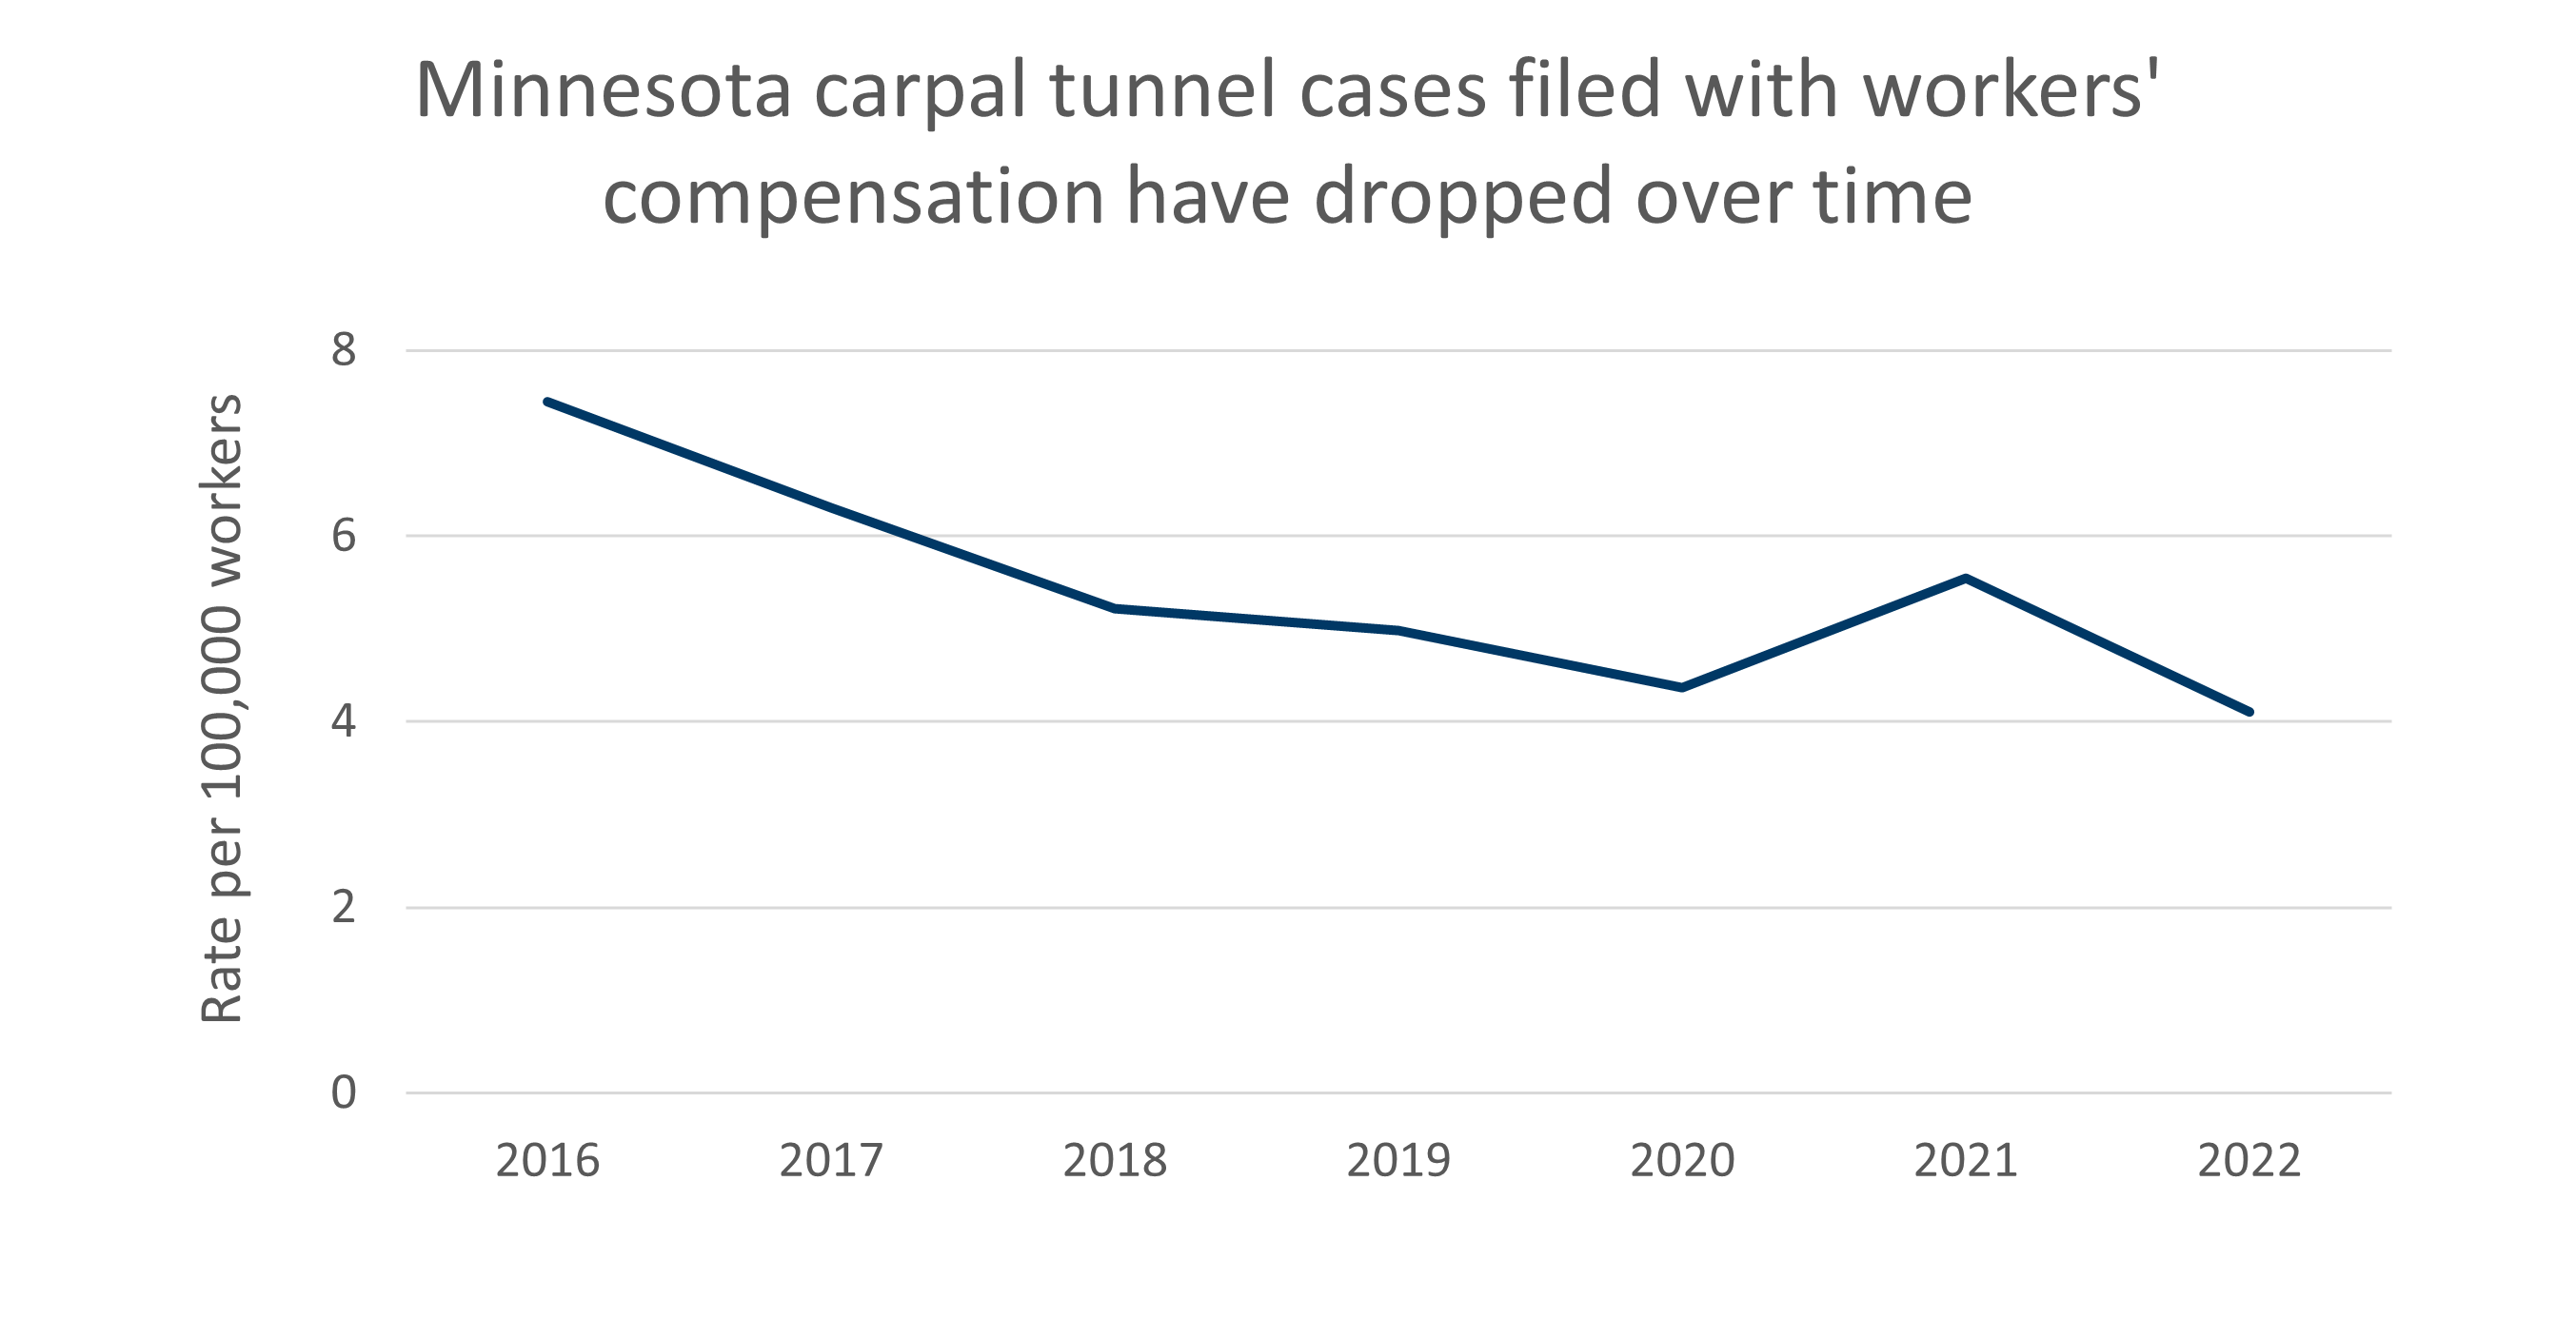
Carpel tunnel cases filed with workers' compensation:
Numerator data are from workers’ compensation claims data provided by the Minnesota Department of Labor and Industry. Denominator data are from the National Academy of Social Insurance estimate of workers covered by workers’ compensation. Carpel tunnel cases reported to workers’ compensation system dropped from 2016 to 2022.
Musculoskeletal disorders
Data Source: Bureau of Labor Statistics Survey of Occupational Injuries and Illnesses (SOII)
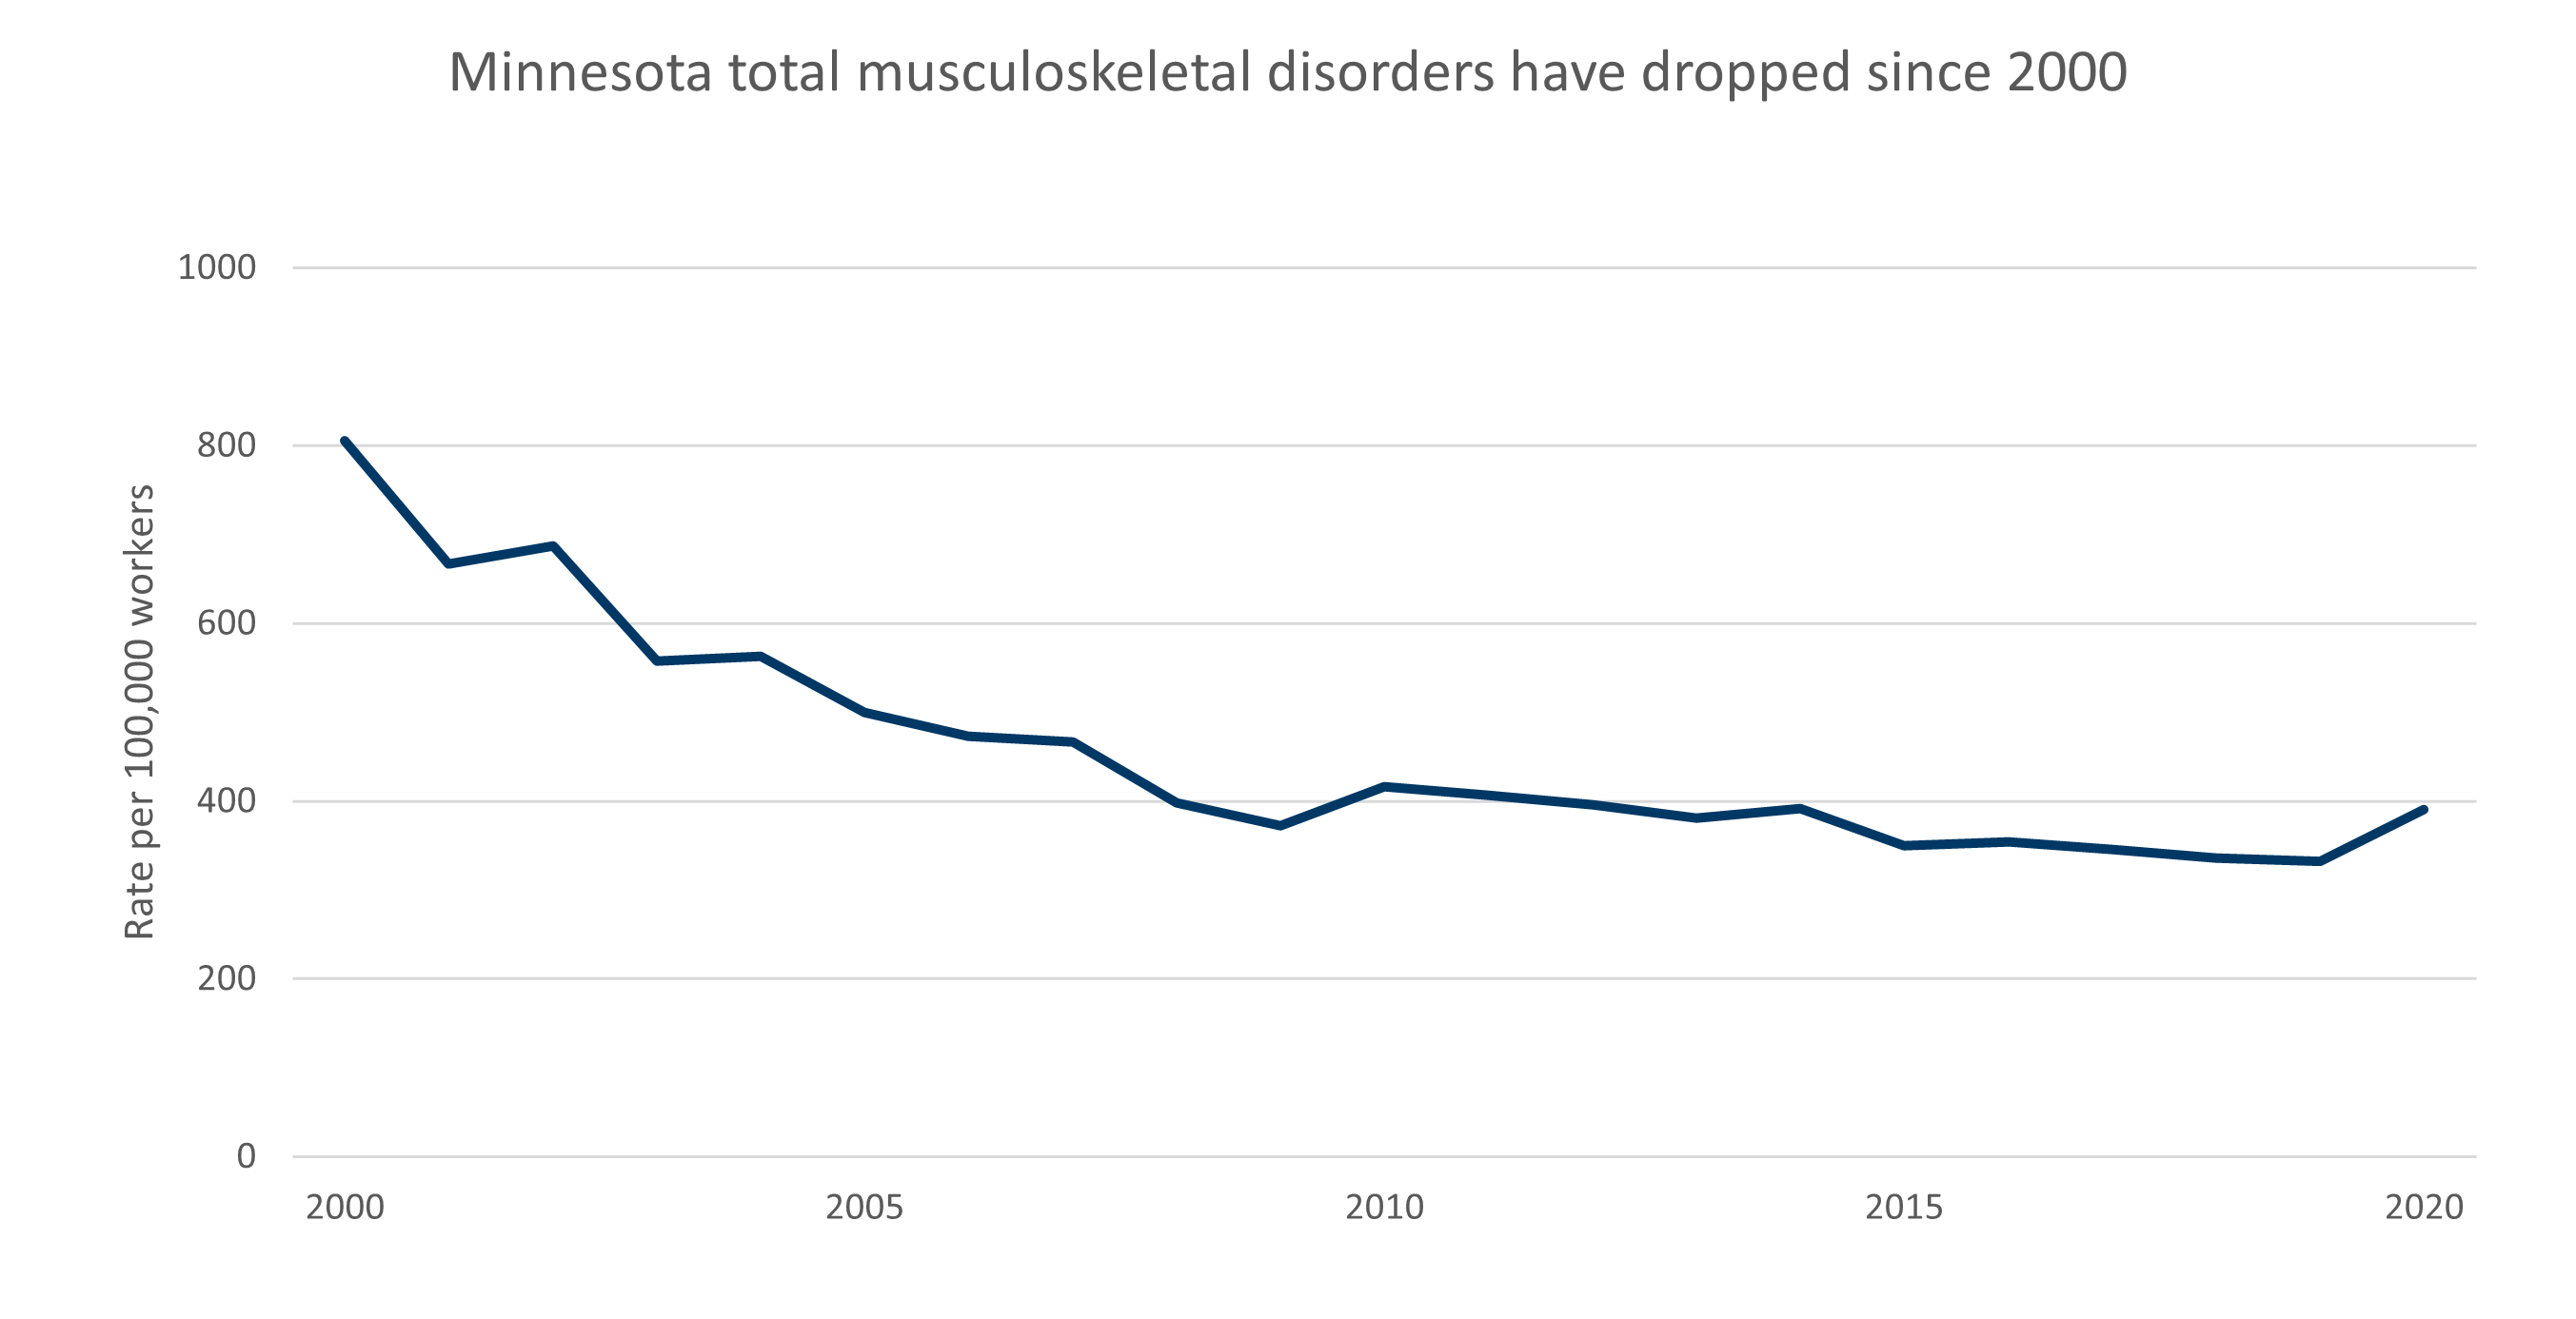
All musculoskeletal disorders (MSDs):
Using national survey data, the number and rate of total work-related musculoskeletal disorders has generally declined from 2000. However, the trend has flattened in recent years but was higher in 2020. Data are from the Bureau of Labor Statistics Survey of Occupational Injuries and Illnesses (SOII). Beginning with 2021 data, the BLS has changed to biennial collection of these data. Therefore, annual data are currently only available through 2020. The SOII uses information reported by employers, thus is dependent on the accuracy and completeness of their reporting. Therefore, the true number and rate of injuries and illnesses is likely to be somewhat higher.
Musculoskeletal disorders of the neck, shoulder, and upper extremities
Data Source: Bureau of Labor Statistics Survey of Occupational Injuries and Illnesses (SOII)
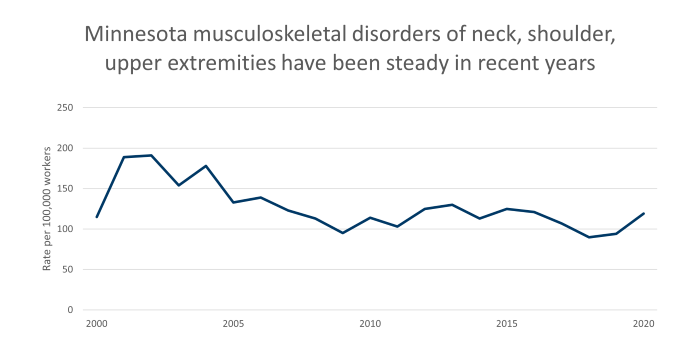
Musculoskeletal disorders of neck, shoulder, upper extremities:
Using national survey data, the number and rate of work-related musculoskeletal disorders of the neck, shoulder, and upper extremities has generally declined from 2000. However, the trend has flattened in recent years. Data are from the Bureau of Labor Statistics Survey of Occupational Injuries and Illnesses (SOII). Beginning with 2021 data, the BLS has changed to biennial collection of these data. Therefore, annual data are currently only available through 2020. The SOII uses information reported by employers, thus is dependent on the accuracy and completeness of their reporting. Therefore, the true number and rate of injuries and illnesses is likely to be somewhat higher.
Musculoskeletal disorders of the back

Data Source: Bureau of Labor Statistics Survey of Occupational Injuries and Illnesses (SOII)
Musculoskeletal disorders of the back:
Using national survey data, the number and rate of musculoskeletal disorders of the back has generally declined since 2000. However, the trend has flattened in recent years. Data are from the Bureau of Labor Statistics Survey of Occupational Injuries and Illnesses (SOII). Beginning with 2021 data, the BLS has changed to biennial collection of these data. Therefore, annual data are currently only available through 2020. The SOII uses information reported by employers, thus is dependent on the accuracy and completeness of their reporting. Therefore, the true number and rate of injuries and illnesses is likely to be somewhat higher.