Contact Info
Infectious Disease Epidemiology, Prevention and Control Division
651-201-5414
Acute Hepatitis Statistics
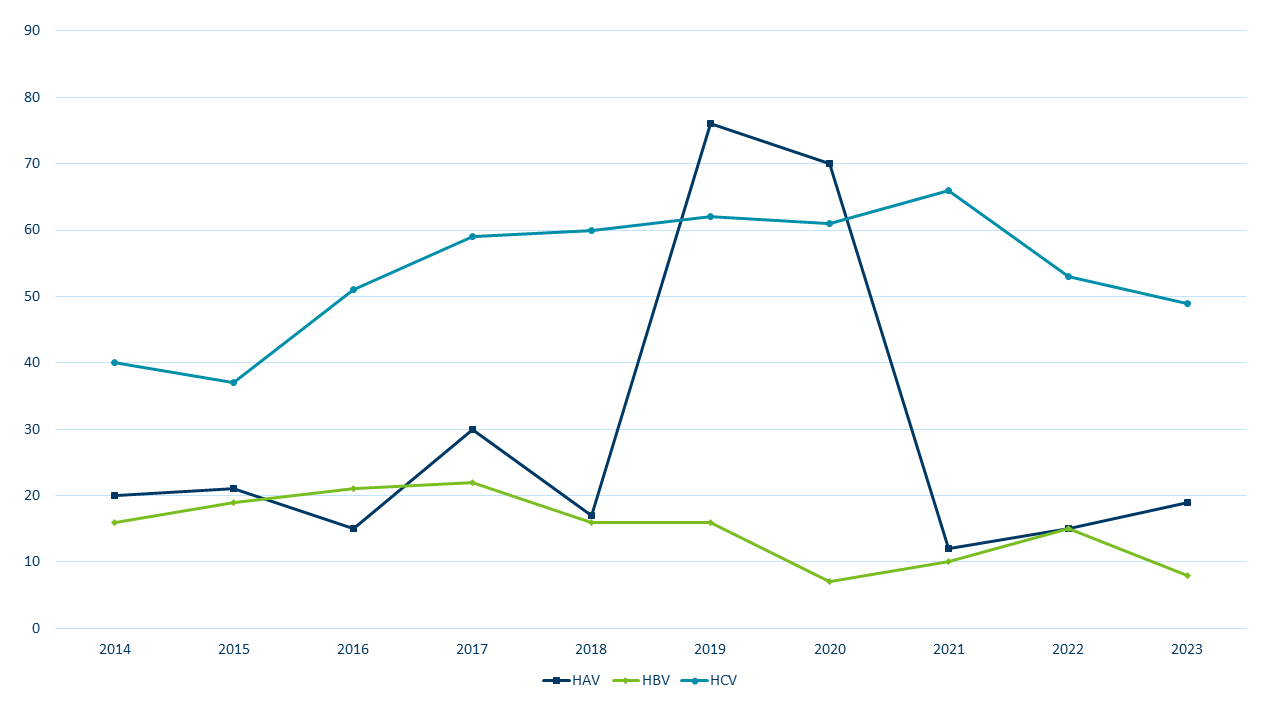
Annual rates of hepatitis A (HAV), acute hepatitis B (HBV), and acute hepatitis C (HCV) disease in Minnesota. Acute cases definitions can change over time. For past and current case definitions visit CDCs National Notifiable Diseases Surveillance System (NNDSS): Surveillance Case Definitions for Current and Historical Conditions.
Number of Acute Cases per Year, 2015-2024

Downloadable data: Number of Acute Cases per Year (CSV)
| Year | HAV | HBV | HCV |
|---|---|---|---|
| 2015 | 21 | 19 | 37 |
| 2016 | 15 | 21 | 51 |
| 2017 | 30 | 23 | 59 |
| 2018 | 16 | 16 | 60 |
| 2019 | 76 | 16 | 62 |
| 2020 | 70 | 7 | 61 |
| 2021 | 12 | 10 | 66 |
| 2022 | 15 | 15 | 53 |
| 2023 | 19 | 8 | 48 |
| 2024 | 20 | 10 | 35 |
Annual Summary Statistics
- Hepatitis: Annual Summary of Reportable Diseases
The Minnesota Department of Health collects information on infectious diseases for the purposes of determining disease impact, assessing trends in disease occurrence, characterizing affected populations, prioritizing control efforts, and evaluating prevention strategies, and reports statistics annually. Note: There are no listings for years in which there were no cases reported. The annual summary archives available on the web go back to 1997.
Last Updated: 08/28/2025