Contact Info
Varicella (Chickenpox) and Zoster (Shingles) Statistics
Updated 07/09/2026
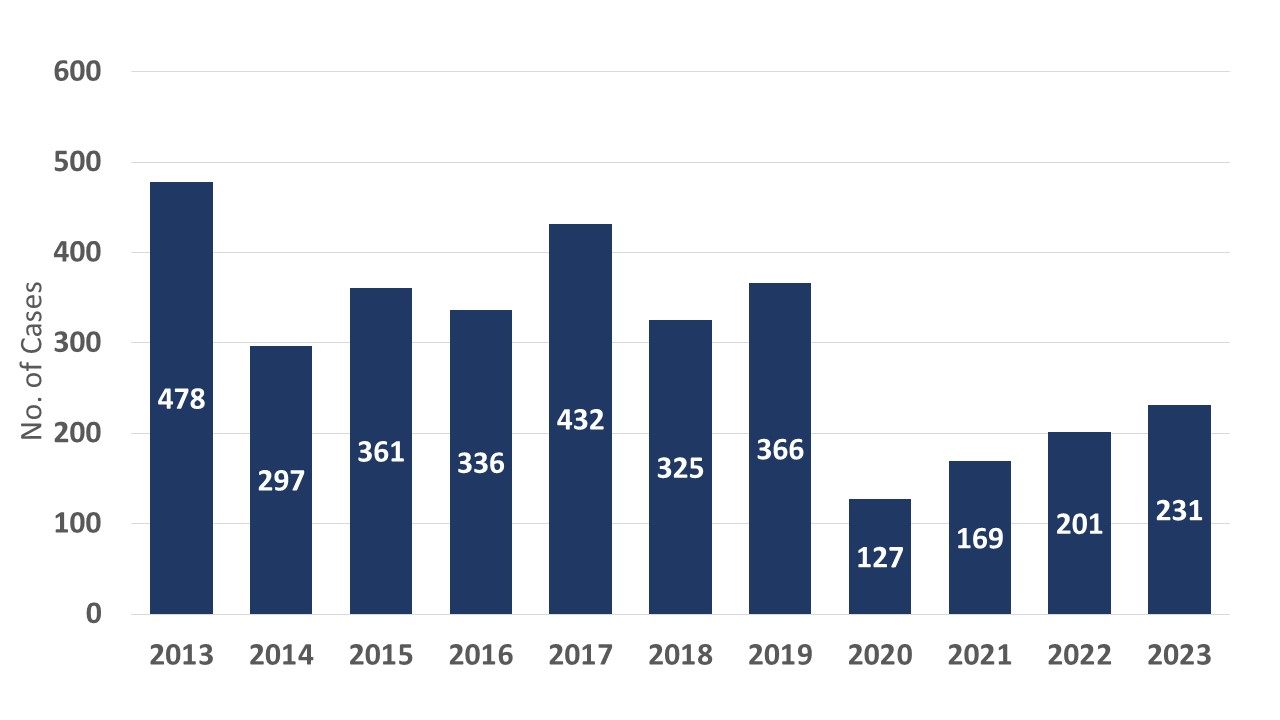
The incidence of varicella (chickenpox) has declined sharply in Minnesota over the last 15 years with the introduction of the varicella vaccine and new immunization recommendations and requirements. From 2005 to 2012, we monitored varicella activity through outbreaks reported by K-12 schools and individual cases reported by selected sentinel schools. When the reported numbers became too low to detect disease trends, the state reporting rule for varicella was revised. Since 2013, healthcare providers, childcares, and schools have been required to report all suspected and confirmed cases of varicella.
On this page:
Varicella and zoster annual statistics
2026 varicella cases to date
Disease Control Newsletter (DCN)
Varicella and zoster annual statistics
Varicella annual case counts, 2015-2025, Minnesota
2026 varicella cases to date
Data are preliminary and may change as reports are received.
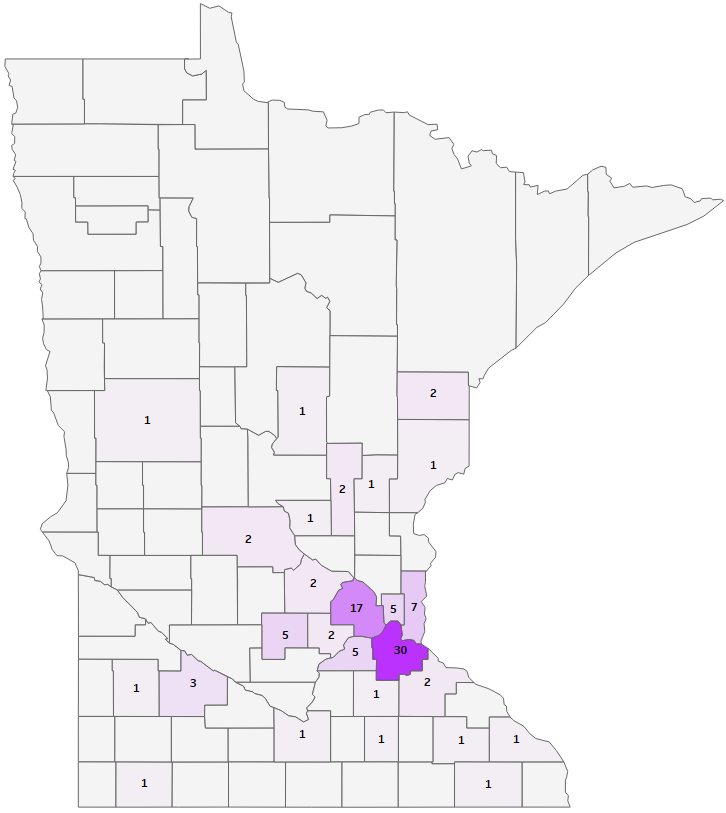
As of July 9, 2026, the number of probable and confirmed cases reported: 166
2026 cases by county map
2026 cases by county table
| County | Number of Cases |
|---|---|
| Aitkin | 0 |
| Anoka | 4 |
| Becker | 0 |
| Beltrami | 0 |
| Benton | 0 |
| Big Stone | 0 |
| Blue Earth | 1 |
| Brown | 0 |
| Carlton | 0 |
| Carver | 2 |
| Cass | 1 |
| Chippewa | 1 |
| Chisago | 2 |
| Clay | 2 |
| Clearwater | 0 |
| Cook | 0 |
| Cottonwood | 0 |
| Crow Wing | 2 |
| Dakota | 10 |
| Dodge | 0 |
| Douglas | 4 |
| Faribault | 0 |
| Fillmore | 0 |
| Freeborn | 0 |
| Goodhue | 0 |
| Grant | 0 |
| Hennepin | 20 |
| Houston | 0 |
| Hubbard | 2 |
| Isanti | 0 |
| Itasca | 3 |
| Jackson | 0 |
| Kanabec | 0 |
| Kandiyohi | 1 |
| Kittson | 0 |
| Koochiching | 0 |
| Lac Qui Parle | 1 |
| Lake | 0 |
| Lake of the Woods | 0 |
| Le Sueur | 0 |
| Lincoln | 0 |
| Lyon | 0 |
| Mahnomen | 0 |
| Marshall | 0 |
| Martin | 4 |
| McLeod | 5 |
| Meeker | 0 |
| Mille Lacs | 1 |
| Morrison | 1 |
| Mower | 0 |
| Murray | 0 |
| Nicollet | 0 |
| Nobles | 0 |
| Norman | 0 |
| Olmsted | 7 |
| Otter Tail | 1 |
| Pennington | 0 |
| Pine | 3 |
| Pipestone | 0 |
| Polk | 1 |
| Pope | 0 |
| Ramsey | 10 |
| Red Lake | 0 |
| Redwood | 0 |
| Renville | 0 |
| Rice | 1 |
| Rock | 0 |
| Roseau | 0 |
| Scott | 3 |
| Sherburne | 11 |
| Sibley | 0 |
| St. Louis | 0 |
| Stearns | 4 |
| Steele | 0 |
| Stevens | 0 |
| Swift | 0 |
| Todd | 0 |
| Traverse | 0 |
| Wabasha | 1 |
| Wadena | 0 |
| Waseca | 1 |
| Washington | 7 |
| Watonwan | 0 |
| Wilkin | 0 |
| Winona | 0 |
| Wright | 48 |
| Yellow Medicine | 0 |
| Unknown | 0 |
Disease Control Newsletter (DCN)
- Varicella: Annual Summary of Reportable Diseases
The Minnesota Department of Health collects information on infectious diseases for the purposes of determining disease impact, assessing trends in disease occurrence, characterizing affected populations, prioritizing control efforts, and evaluating prevention strategies, and reports statistics annually. Note: There are no listings for years in which there were no cases reported. The annual summary archives available on the web go back to 1997. - Zoster: Annual Summary of Reportable Diseases
The Minnesota Department of Health collects information on infectious diseases for the purposes of determining disease impact, assessing trends in disease occurrence, characterizing affected populations, prioritizing control efforts, and evaluating prevention strategies, and reports statistics annually. Note: There are no listings for years in which there were no cases reported. The annual summary archives available on the web go back to 1997.