Drinking Water Protection
- Drinking Water Protection Home
- About Us
- A-Z Index of Contaminants in Water
- Community Public Water Supply
- Drinking Water Grants and Loans
- Drinking Water Institute
- Drinking Water in Schools and Child Cares
- Drinking Water Revolving Fund
- Laws and Rules
- Noncommunity Public Water Supply
- Source Water Protection
- Water Operator and Certification Training
- Drinking Water Protection Contacts
Related Topics
- Annual Reports
- Drinking Water Risk Communication Toolkit
- Fact Sheets
- Forms
- Invisible Heroes Videos: Minnesota's Drinking Water Providers
- Noncom Notes Newsletter
- Sample Collection Procedures (videos, pictures, written instructions)
- Waterline Newsletter
Related Sites
- 10 States Standards
- Clean Water Fund
- Health Risk Assessment – Guidance Values and Standards for Water
- Minnesota Well Index
- Water and Health
- Wells and Borings
Environmental Health Division
Interactive Dashboard for PFAS Testing in Drinking Water
MDH has tested for per- and polyfluoroalkyl substances (PFAS) in community water systems (CWSs) across the state. A goal of this initiative was to evaluate whether Minnesotans are exposed to PFAS at levels above health-based guidance values (HBVs) in drinking water.
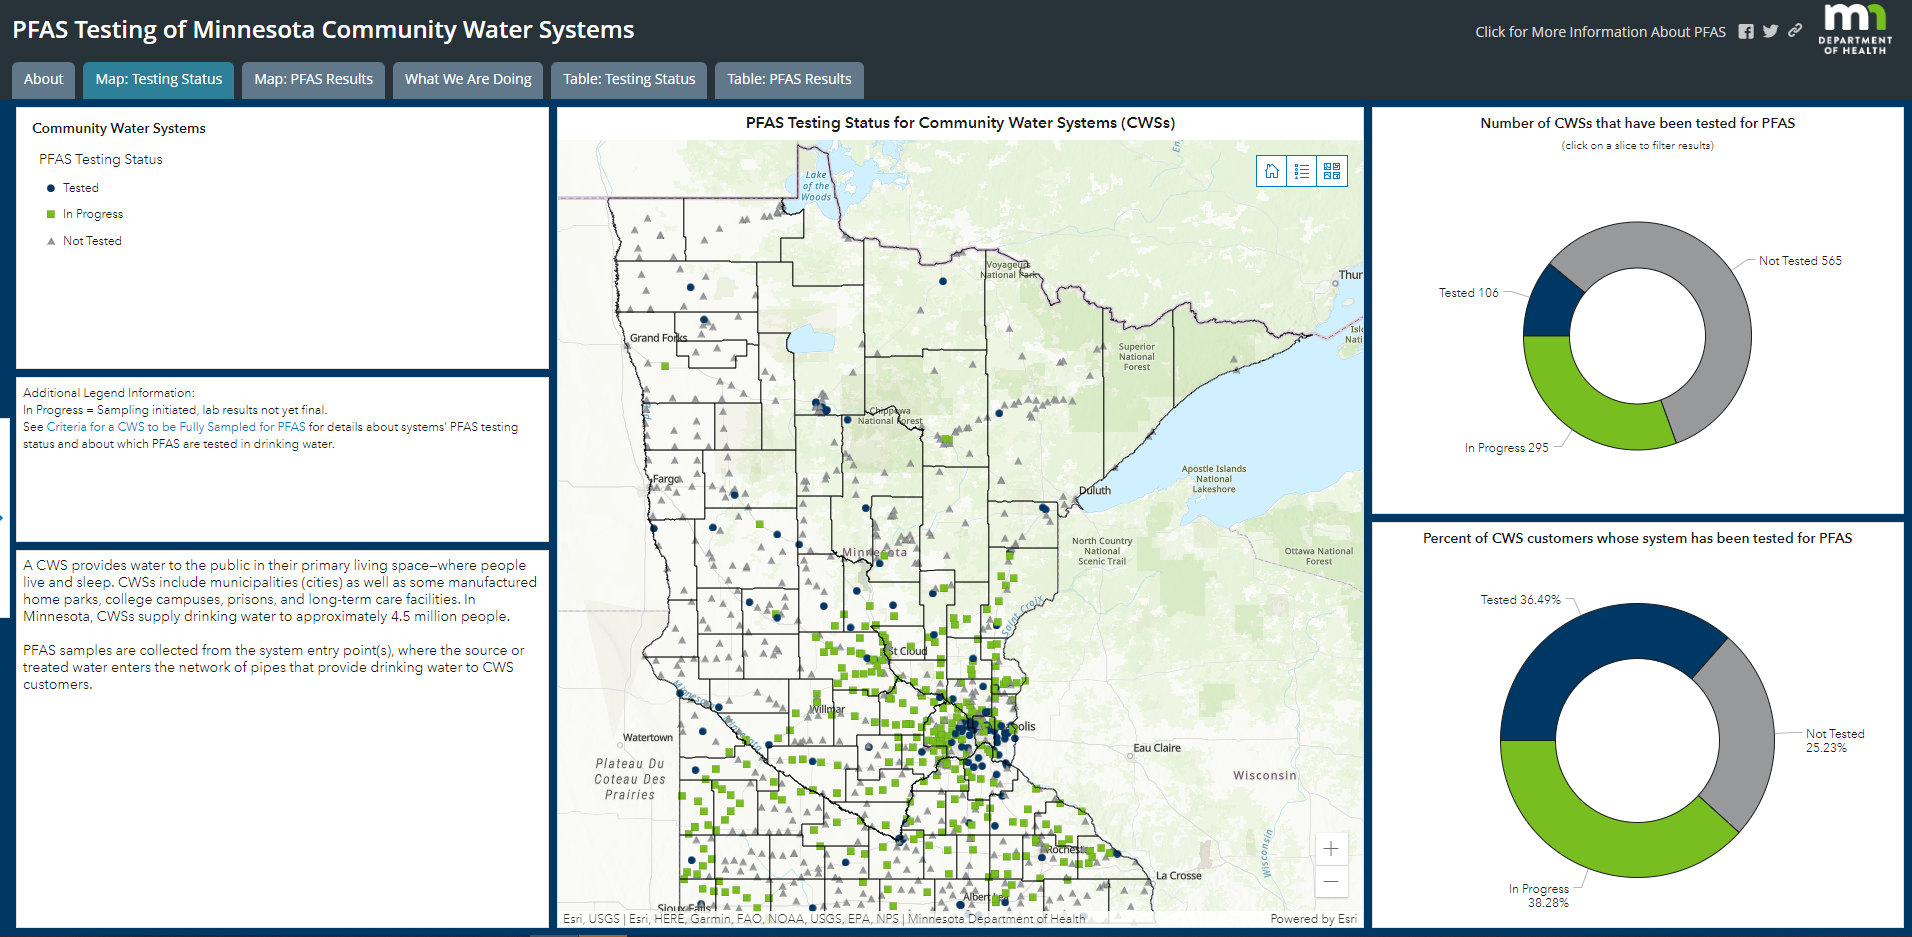
Our Interactive Dashboard for PFAS Testing in Drinking Water shows the status and results of PFAS testing for CWSs in Minnesota. In the dashboard maps, you can see each CWS's PFAS testing results.
The dashboard uses MDH HBVs for PFAS in drinking water. MDH recently released revised HBVs for perfluorooctoanoic acid (PFOA) and perfluorooctane sulfonic acid (PFOS). MDH is evaluating how to incorporate the updated PFOS and PFOA guidance values into its risk assessment for PFAS in drinking water. We will update the dashboard as needed after this evaluation is complete. Additionally, we are working on updates to the dashboard to incorporate new federal primary drinking water standards for PFAS. We will keep systems informed and continue working with systems to address PFAS.
If users find that data are not loading on the dashboard map, zooming in on the map will help the dashboard data load faster.
The Statewide PFAS Monitoring Project has been made possible through funding from the Clean Water Fund and U.S. Environmental Protection Agency.
- Federal developments on PFAS
- How to use the interactive dashboard
- Information in the dashboard
- What do the PFAS testing results mean?
- About data used in the map
- For more information
- PFAS in Drinking Water (PDF) (English) | PFAS nyob hauv Cov Dej Haus (PDF) (Hmong) | PFAS ku jirta Biyaha la Cabo (PDF) (Somali) | PFAS en el agua potable (PDF) (Spanish)
Federal developments on PFAS
U.S. Environmental Protection Agency (EPA) has implemented National Primary Drinking Water Regulation for PFOA, PFOS, PFNA, PFHxS, and GenX, including maximum contaminant levels (MCLs). EPA has also released enforceable limits for four PFAS (PFBS, PFHxS, GenX and PFNA) that would be evaluated in combination with each other using an approach called a Hazard Index.
For more information, see the EPA webpages Per- and Polyfluoroalkyl Substances (PFAS) and Drinking Water Health Advisories.
How to use the interactive dashboard
In the dashboard maps, you can:
- Navigate to an area by zooming in and out or moving the map with your mouse;
- Click on a CWS to view more information about it as well as its PFAS results;
- Use the left side panel to search for CWSs by county;
- Show the legend on the map; and
- Change the basemap.
Information in the dashboard
The About tab contains information about PFAS and testing for drinking water.
The Map: Testing Status tab shows which CWSs have been tested already, which have not been tested yet, and which are in progress. Clicking on each CWS will show its status as well as information about the system.
The Map: MDH Guidance tab shows the PFAS testing results for individual CWSs in relation to MDH's health-based guidance. Clicking on each CWS will show its results for individual PFAS. It will also show whether or not the combined PFAS results exceed the Health Risk Index (HRI).
The Map: EPA Standards tab shows the PFAS testing results for individual CWSs in relation to EPA's MCLs, including whether or not the combined PFAS results exceed the Hazard Index.
the Table: Testing Status, Table: MDH Guidance, and Table: EPA Standards tabs show the same information as the map pages above in table format.
The tab, What We Are doing, contains more information about actions CWSs and MDH take to reduce PFAS in drinking water. It also has links for more information.
What do the PFAS testing results mean?
If the HRI is less than or equal to one, the PFAS levels in drinking water are considered safe for all people to consume.
Drinking water with PFAS test results above the HRI poses a potential health concern. It does not represent an immediate health risk. The guidance values are based on multiple safety factors and are overprotective for most people.
Some PFAS are commonly found at low levels in drinking water. It is rare to find elevated PFAS in drinking water outside of communities with contaminated sites.
CWSs with elevated PFAS can take actions to provide drinking water with PFAS levels that are as low as possible. These actions include shutting off the most contaminated wells, using wells that are clean or have lower levels of PFAS, blending water from their wells to minimize PFAS levels in drinking water, or installing treatment for PFAS.
More information about PFAS and health effects, treatment, and private wells can be found at Per- and Polyfluoroalkyl Substances (PFAS).
About data used in the dashboard
What does the Health Risk Index (HRI) range represent?
The HRI range shows the highest and lowest testing results across the locations that supply water to the city ("entry points"). Some community water systems only have one location that supplies water to the city. These communities will have one number shown for the HRI instead of a range.
Under the Statewide PFAS Monitoring Project, MDH tested most community systems one time, so the range represents testing results from the day samples were collected.
A small number of community water systems with past PFAS detections have regular PFAS testing. For these systems, the HRI range represents the running average from the last four quarters.
How is the HRI calculated?
When MDH finds more than one PFAS in drinking water, MDH evaluates their “additive” health risk. An HRI calculation is used to evaluate the combined risk from chemicals that have similar health effects.
MDH calculates the HRI for PFAS with similar health effects and current, state health-based guidance values. The concentration of each PFAS is divided by its health-based guidance value (in ug/L, or parts per billion). Any exceedance of a health-based guidance value for one PFAS results in an exceedance of the HRI as well.
For additional information, see Evaluating Concurrent Exposures to Multiple Chemicals.
How does the dashboard data change if guidance values are updated in the future?
Health-based guidance values can change over time as we learn more about PFAS and its health risks. This is a normal part of the scientific process. Our understanding of PFAS evolves over time as we gain new information and evidence from scientific research.
If MDH updates guidance values for PFAS in the future, MDH will evaluate community water systems' testing results to determine whether they are affected by updated guidance, whether additional testing is needed for more information, and what recommendations to provide. MDH takes a cautious public health approach and will continue to inform the public about any ways they can reduce exposure to these chemicals while guidance is being assessed.
What do MDH and systems do if PFAS levels are elevated?
If testing results show PFAS levels at half of the HRI or above, MDH tests for PFAS again to ensure that the results are accurate and representative. MDH and CWSs discuss recommendations and next steps at this time. MDH continues to test for PFAS in all affected communities.
Which PFAS were tested in drinking water?
For a full list of the PFAS tested across analytical methods, see Criteria for a PWS to be 'Fully' Sampled for PFAS (PDF). Only PFAS detected at each CWS are shown on the map. Contact health.drinkingwater@state.mn.us with questions about testing or results from individual CWSs.
What data is included on the dashboard?
This map includes data from the Statewide PFAS Monitoring Project and the Unregulated Contaminants Monitoring Project (see: Drinking Water Ambient Monitoring Program). Because PFAS are not regulated under the Safe Drinking Water Act, CWSs are not required to test their drinking water for PFAS. CWSs on the map have volunteered to participate in this project and to make their PFAS testing results publicly available.
Where were samples collected?
Most of the data in the map is from samples taken at the entry point(s) instead of individual wells. The entry point is where finished drinking water enters the distribution system. MDH’s sampling approach for the Statewide PFAS Monitoring Project is to collect samples that represent what customers drink from the tap as closely as possible. For some systems, the map shows results from individual wells.
For more information
Contact health.drinkingwater@state.mn.us or the CWS with questions about individual systems and their results. Contact health.risk@state.mn.us with questions about PFAS health risks.
- To learn more about this project, see:
- PFAS Testing in Public Water Systems
For more information about PFAS, see Per- and Polyfluoroalkyl Substances (PFAS).
Go to > top.